Editorial Note: We are an inventory management software provider. While some of our blog posts may highlight features of our own product, we strive to provide unbiased and informative content that benefits all readers.
Average inventory is the average amount of inventory that a company has on hand over a specific period of time.
It is calculated by adding the beginning and ending inventory levels for the period and dividing by two.
Average inventory is important for a number of reasons:
- It helps businesses to understand their inventory turnover rate. The inventory turnover rate is a measure of how often a company sells and replaces its inventory. It is calculated by dividing the cost of goods sold by the average inventory. A higher inventory turnover rate indicates that a company is selling its inventory quickly and efficiently. This is important because it means that the company is not tying up too much capital in inventory and that it is able to respond to changes in customer demand quickly.
- It helps businesses to determine their optimal inventory levels. Average inventory can be used to help businesses determine how much inventory they need to have on hand to meet customer demand without overstocking. If a company has too much inventory, it will have to pay for the storage and insurance of the excess inventory. If a company has too little inventory, it may risk running out of stock and losing sales.
- It helps businesses to identify inventory trends. By tracking average inventory over time, businesses can identify trends in their inventory levels, such as seasonal fluctuations or increases in demand for certain products. This information can be used to make better decisions about inventory management, such as when to order new inventory and how much inventory to order.
- It helps businesses to make budgeting decisions. Average inventory can be used to estimate the amount of money that a company will need to spend on inventory in the future. This information can be used to create a more accurate budget.
Average inventory is an important metric for businesses of all sizes to track. It can help businesses to make better decisions about inventory management, budgeting, and pricing.
Here are some specific examples of how businesses can use average inventory:
- A clothing retailer can use average inventory to determine how much inventory to order for each season.
- A grocery store can use average inventory to determine how much inventory to order for each week.
- A manufacturing company can use average inventory to determine how much raw materials to order and how much finished goods to keep in stock.
By tracking and analyzing average inventory, businesses can improve their efficiency and profitability.
How to Use Average Inventory:
Average inventory can be used in a variety of ways, including:
- To track inventory levels over time. By tracking average inventory over time, businesses can identify trends in their inventory levels, such as seasonal fluctuations or increases in demand for certain products. This information can be used to make better decisions about inventory management, such as when to order new inventory and how much inventory to order.
- To forecast future inventory needs. Average inventory can be used to forecast future inventory needs based on historical sales data and trends. This information can be used to ensure that businesses have enough inventory on hand to meet customer demand without overstocking.
- To calculate inventory turnover ratio. The inventory turnover ratio is a measure of how often a company sells and replaces its inventory. It is calculated by dividing the cost of goods sold by the average inventory. A higher inventory turnover ratio indicates that a company is selling its inventory quickly and efficiently.
- To calculate inventory days on hand. Inventory days on hand is a measure of the number of days it takes a company to sell its entire inventory. It is calculated by dividing the average inventory by the cost of goods sold per day. A lower inventory days on hand indicates that a company is selling its inventory quickly and efficiently.
- To make budgeting decisions. Average inventory can be used to estimate the amount of money that a company will need to spend on inventory in the future. This information can be used to create a more accurate budget.
Here are some specific examples of how businesses can use average inventory:
- A clothing retailer can use average inventory to determine how much inventory to order for each season. For example, if a retailer knows that its average inventory for the spring season is $1 million, it can use this information to forecast its inventory needs for the next spring season.
- A grocery store can use average inventory to determine how much inventory to order for each week. For example, if a grocery store knows that its average inventory for the week is $500,000, it can use this information to determine how much inventory to order for the next week.
- A manufacturing company can use average inventory to determine how much raw materials to order and how much finished goods to keep in stock. For example, if a manufacturing company knows that its average inventory for raw materials is $100,000 and its average inventory for finished goods is $200,000, it can use this information to determine how much raw materials to order and how much finished goods to keep in stock.
By tracking and analyzing average inventory, businesses can improve their efficiency and profitability.
Average Inventory Formula:
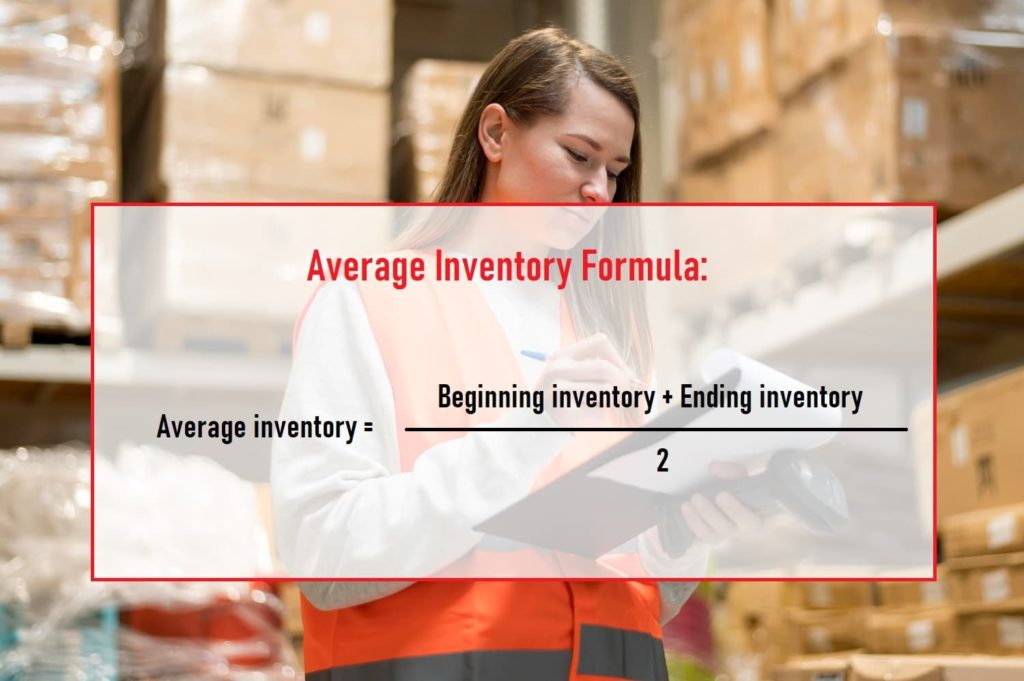
The average inventory formula is:
Average inventory = (Beginning inventory + Ending inventory) / 2
This formula calculates the average amount of inventory that a company has on hand over a specific period of time. The period of time can be any length, such as a month, quarter, or year.
To calculate average inventory, you will need to know the company’s beginning and ending inventory levels for the period of time that you are calculating. The beginning inventory is the amount of inventory that the company has on hand at the start of the period. The ending inventory is the amount of inventory that the company has on hand at the end of the period.
Once you have the beginning and ending inventory levels, you simply add them together and divide by two to get the average inventory.
For example, let’s say that a company has a beginning inventory of $100,000 and an ending inventory of $50,000 for the month of January. The company’s average inventory for January would be calculated as follows:
Average inventory = ($100,000 + $50,000) / 2 = $75,000
This means that the company had an average of $75,000 in inventory on hand during the month of January.
Average inventory can be used for a variety of purposes, such as:
- Tracking inventory levels over time
- Forecasting future inventory needs
- Calculating inventory turnover ratio
- Calculating inventory days on hand
- Making budgeting decisions
Average inventory is an important metric for businesses of all sizes to track. It can help businesses to make better decisions about inventory management, budgeting, and pricing.
How to Calculate Average Inventory:
To calculate average inventory, you will need to know the company’s beginning and ending inventory levels for the period of time that you are calculating. The beginning inventory is the amount of inventory that the company has on hand at the start of the period. The ending inventory is the amount of inventory that the company has on hand at the end of the period.
Once you have the beginning and ending inventory levels, you simply add them together and divide by two to get the average inventory.
Formula:
Average inventory = (Beginning inventory + Ending inventory) / 2
Example-1:
Let’s say that a company has a beginning inventory of $100,000 and an ending inventory of $50,000 for the month of January. The company’s average inventory for January would be calculated as follows:
Average inventory = ($100,000 + $50,000) / 2 = $75,000
This means that the company had an average of $75,000 in inventory on hand during the month of January.
Average inventory can be calculated for any period of time, such as a month, quarter, or year. It is important to note that average inventory is just a snapshot of a company’s inventory levels at a particular point in time. It does not take into account changes in inventory levels throughout the period.
Despite its limitations, average inventory is a valuable tool for businesses to use in managing their inventory. By tracking average inventory levels and trends, businesses can make better decisions about how much inventory to order and how to allocate their resources.
Example-2:
A company has the following inventory levels for the month of January:
- Beginning inventory: $100,000
- Ending inventory: $50,000
To calculate the company’s average inventory for January, we would use the following formula:
Average inventory = (Beginning inventory + Ending inventory) / 2
Calculation:
Average inventory = ($100,000 + $50,000) / 2 = $75,000
Therefore, the company’s average inventory for January was $75,000.
This means that the company had an average of $75,000 in inventory on hand throughout the month of January.
Average inventory can be calculated for any period of time, such as a month, quarter, or year. It is an important metric for businesses to track because it can help them to make better decisions about inventory management, budgeting, and pricing.
Here are some tips for calculating average inventory:
- Make sure that you are using the same accounting method to calculate your beginning and ending inventory levels.
- If you have a large amount of inventory, you may want to use a spreadsheet or accounting software to help you calculate your average inventory.
- If you are calculating average inventory for a long period of time, you may want to break it down into shorter periods, such as months or quarters. This will make the calculation easier and more accurate.
Conclusion:
Average inventory is an important metric for businesses of all sizes to track. It can help businesses to understand their inventory turnover rate, determine their optimal inventory levels, identify inventory trends, and make budgeting decisions.
Average inventory is calculated by adding the beginning and ending inventory levels for a period of time and dividing by two. It is important to note that average inventory is just a snapshot of a company’s inventory levels at a particular point in time. It does not take into account changes in inventory levels throughout the period.
Despite its limitations, average inventory is a valuable tool for businesses to use in managing their inventory. By tracking average inventory levels and trends, businesses can make better decisions about how much inventory to order and how to allocate their resources.

Take a Quiz Test - Test Your Skill
Test your inventory management knowledge. Short multiple-choice tests, you may evaluate your comprehension of Inventory Management.