
Demand forecasting is the process of predicting the future demand for a product or service.
It involves analyzing historical data and other relevant information to make an estimate of how much of a product or service will be required in the future.

The purpose of demand forecasting is to help businesses make informed decisions about production, inventory management, pricing, and other critical aspects of operations.
Demand forecasting is an important tool for companies as it helps them to ensure they have the right products available in the right quantities at the right time to meet customer demand.
This helps companies to minimize waste, reduce costs, and increase efficiency, which can result in improved financial performance.
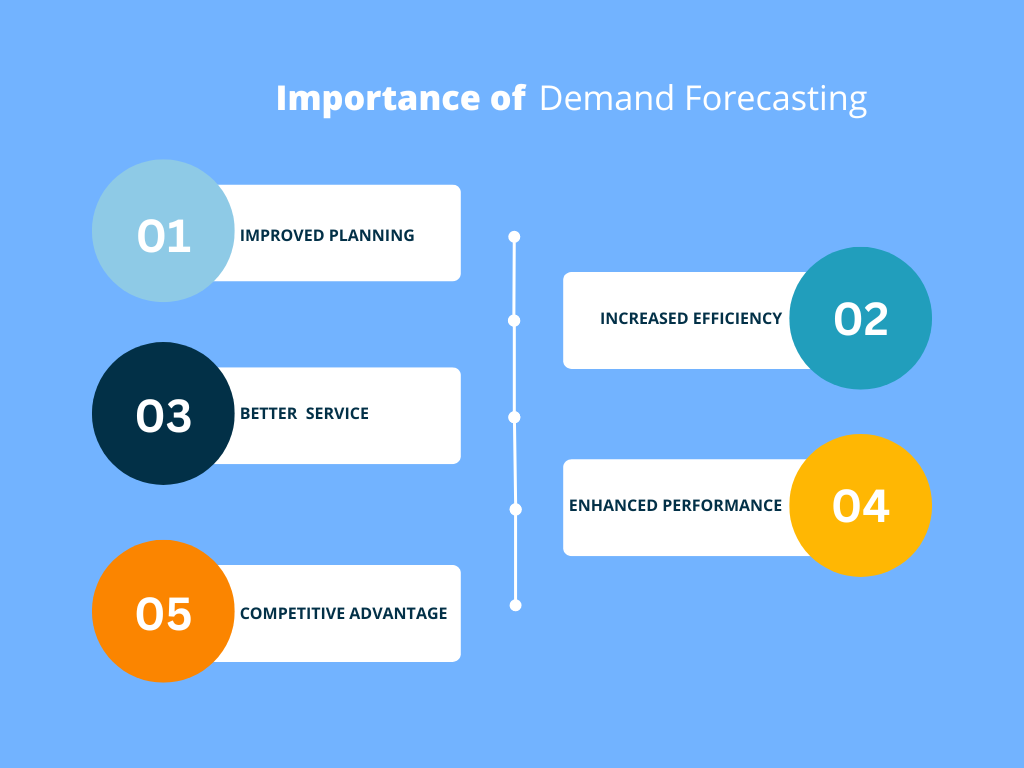
Importance and Benefits of Demand Forecasting:
Demand forecasting is not merely a “nice-to-have”; it’s a fundamental pillar of modern business strategy. Accurate forecasting provides a critical roadmap for companies, enabling them to make smarter, data-driven decisions that impact everything from the factory floor to the bottom line. Here’s a deep dive into its importance, backed by key statistics and reputable sources.
1. Optimizing Inventory Management
One of the most immediate and significant benefits of accurate demand forecasting is its impact on inventory. Overstocking leads to high holding costs, potential product obsolescence, and tied-up capital. Conversely, understocking results in lost sales, frustrated customers, and damage to brand reputation.
- According to Gartner, manufacturers with strong demand forecasting capabilities achieve 15% less inventory and 17% better order fulfillment, along with other benefits like shorter cash-to-cash cycles and higher profit margins ( IT Convergence ).
2. Enhancing Supply Chain Efficiency
The supply chain is a complex network of suppliers, manufacturers, and distributors. Demand forecasting acts as the central nervous system, providing the necessary signals for each part to function in harmony.
- McKinsey estimates that a 10–20% improvement in forecast accuracy can lead to a 5% reduction in inventory costs and a 2–3% increase in revenue ( New Horizon Supchains ).
- McKinsey evidence shows AI-driven demand forecasting can reduce errors by up to 50%, thereby minimizing inventory waste ( loginextsolutions ).
- Forbes reports that AI helps supply chains become smarter and more efficient, enabling real-time rerouting and avoiding costly delays ( Forbes ).
3. Strategic Financial Planning & Budgeting
Demand forecasts are a primary input for a company’s financial health. They inform key financial decisions, including revenue projections, capital expenditure planning, and cash flow management.
- The forecast data is vital for sales and operations planning (S&OP), a process where sales, marketing, and finance departments align their goals. Without a solid forecast, this strategic alignment is impossible, leading to miscommunication and wasted effort across the organization.
4. Improving Customer Satisfaction
In today’s competitive landscape, customer satisfaction and loyalty are paramount. A company that consistently has products in stock and delivers on time builds trust and long-term relationships.
- According to IHL Group’s 2023 Retail Inventory Distortion Report, global inventory distortion (shrinkage, stock-outs, and overstocks) cost retailers an estimated $1.77 trillion in 2023—more than the combined retail GDP of Latin America (IHL Group Study Info via www.retailtouchpoints.com). By leveraging accurate demand forecasts, businesses can drastically reduce these stockout events, ensuring a positive customer experience and repeat business.
- Retailers carrying excess inventory incur 25–30% holding costs annually, while stockouts may cost up to 4.1% of annual revenue (IHL Group) ( Number Analytics ).
5. Competitive Advantage
Ultimately, the ability to forecast demand effectively is a key competitive differentiator. A company that can better anticipate market changes, consumer trends, and economic shifts can respond faster and more strategically than its rivals.
- PwC’s 2024 Cloud & AI Business Survey found that top performers are twice as likely to have already achieved measurable value from generative AI compared to other companies ( PwC ).
- A Deloitte discussion notes Amazon leverages AI-powered algorithms to predict customer demand and optimize inventory across its fulfillment network ( C-Suite Strategy ).
The Importance of Demand Forecasting: A Summary Table
Demand forecasting is crucial for modern businesses, providing a data-driven roadmap for strategic decisions. The following table summarizes its key benefits and provides supporting statistics from reputable sources.
| Aspect | Impact of Demand Forecasting | Supporting Statistics & References |
| 1. Optimizing Inventory Management | Reduces overstocking and understocking, lowering costs and preventing lost sales. | 📊 Gartner: Manufacturers with strong forecasting have 15% less inventory and 17% better order fulfillment. 💰 IHL Group: Inventory distortion (stockouts and overstocks) cost retailers an estimated $1.77 trillion in 2023. |
| 2. Enhancing Supply Chain Efficiency | Improves production planning and resource allocation, making the supply chain more resilient. | 📈 McKinsey: A 10–20% improvement in forecast accuracy can lead to a 5% reduction in inventory costs and a 2–3% revenue increase. 🤖 loginextsolutions: AI-driven forecasting can reduce errors by up to 50%. |
| 3. Strategic Financial Planning & Budgeting | Provides a basis for accurate revenue projections, capital expenditure, and cash flow management. | 🤝 The forecast is vital for Sales and Operations Planning (S&OP), ensuring that sales, marketing, and finance goals are aligned. |
| 4. Improving Customer Satisfaction | Ensures product availability, which builds trust and loyalty with customers. | 🛒 IHL Group: Stockouts may cost up to 4.1% of annual revenue. 💲 Number Analytics: Retailers with excess inventory incur 25–30% holding costs annually. |
| 5. Competitive Advantage | Enables a company to anticipate market changes and respond faster than competitors. | 🚀 PwC: Top performers are twice as likely to have achieved measurable value from generative AI. 💡 Deloitte: Amazon uses AI-powered algorithms to predict demand and optimize inventory. |

Different Methods of Demand Forecasting:
There are several methods of demand forecasting, including:
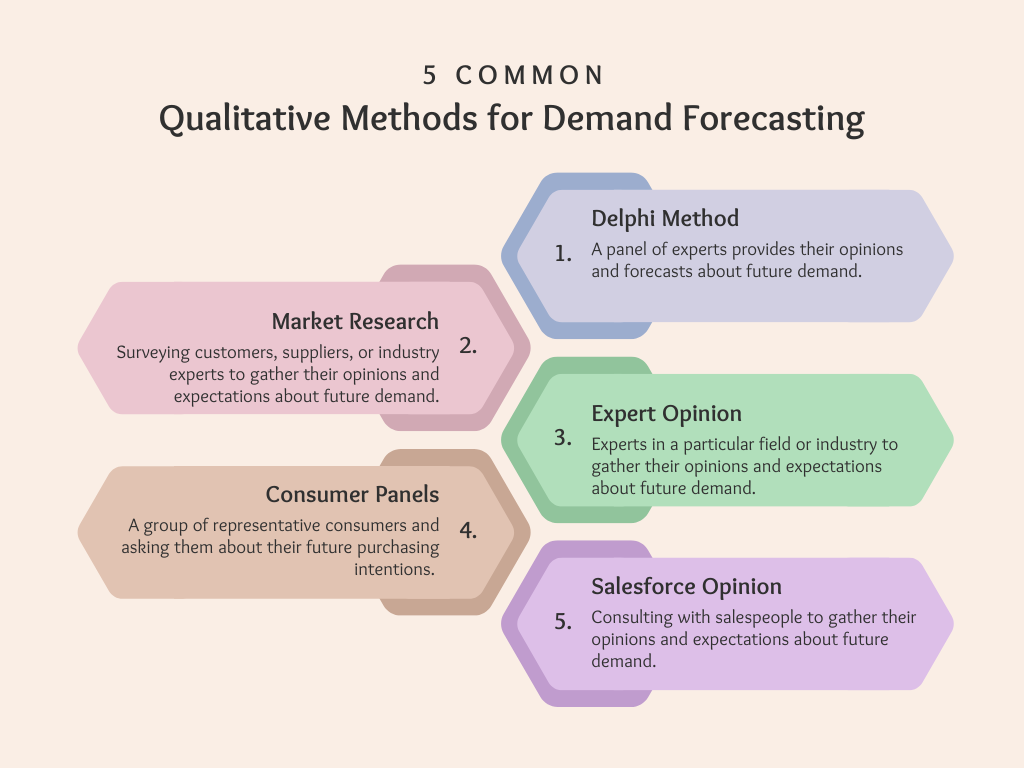
1. Qualitative Methods:
These methods are based on judgment and opinions of experts, such as industry analysts, salespeople, and market researchers. Examples of qualitative methods include the Delphi method and market research surveys.
Qualitative methods of demand forecasting are based on judgment and opinions, rather than numerical data.
Strengths and Applications:
Best suited for:
- Early-stage businesses: When historical data is limited or nonexistent, expert judgment based on industry knowledge and competitor analysis can provide valuable initial forecasts.
- New product launches: Predicting demand for entirely new products relies heavily on understanding customer trends and preferences, which qualitative methods like surveys and focus groups can capture.
- Uncertain or rapidly evolving markets: In dynamic environments, qualitative methods can identify potential disruptions or shifts missed by solely relying on past data.
- Understanding customer sentiment: Qualitative research like surveys and interviews can reveal valuable insights into customer preferences, buying behaviors, and potential reactions to new offerings.
- Gaining insights into competitor strategies: Industry expert opinions and competitor analysis gathered through qualitative methods can inform your own forecasting strategies.
Limitations and Accuracy:
- Subjectivity: Judgment-based methods are inherently subjective and susceptible to individual biases or incomplete information.
- Limited quantification: Qualitative insights are difficult to translate into concrete numbers, making precise forecasting challenging.
- Accuracy: Accuracy varies depending on the expertise of individuals involved, the quality of research conducted, and the specific situation. While providing valuable direction, these methods cannot guarantee the same level of precision as statistical models with extensive data.
Remember:
- Complementarity: Qualitative methods are most effective when used in conjunction with statistical approaches. Their insights can inform data selection, interpret statistical results, and provide context for future scenarios.
- Continuous Improvement: Regularly revisit and refine your forecasts based on emerging trends, market feedback, and actual sales data.
2. Statistical Methods:
This method assumes that future demand will be similar to past demand and involves analyzing historical data to make predictions. Techniques used in time-series analysis include trend analysis, seasonal analysis, and moving averages.
Delving into Statistical Treasures:
I. Exponential Smoothing: Imagine a crystal ball that learns from the past but keeps an eye on the present. That’s essentially exponential smoothing. It analyzes historical sales data, assigning higher weights to recent data to capture trends and seasonality.
- Types: Simple, Holt-Winters (for trends and seasonality), and Holt-Winters with exponential trend.
- Best for: Products with stable demand or moderate trends.
- Data requirements: Moderate historical data (12-24 months).
- Accuracy: Good for short-term forecasts.
II. ARIMA (Autoregressive Integrated Moving Average): This powerhouse model combines past sales data with its own “errors” to predict future demand. Think of it as a self-correcting algorithm that gets smarter with each forecast.
- Types: Different model variations based on data characteristics.
- Best for: Products with complex patterns, trends, and seasonality.
- Data requirements: Extensive historical data (2-3 years).
- Accuracy: Can be highly accurate for complex scenarios.
III. Other Statistical Approaches:
- Regression analysis: Relates sales to influencing factors (e.g., marketing campaigns, economic indicators).
- Machine learning: Powerful for large datasets and complex patterns, but requires expertise.
Remember: Each technique has its strengths and limitations. Understanding data requirements and accuracy levels is crucial for choosing the right fit for your industry and products.
Actionable Tips:
- Start simple: Begin with basic methods like moving averages and progress to more complex techniques as your data allows.
- Combine methods: Consider using a combination of approaches for improved accuracy.
- Don’t forget the human touch: Statistical models are powerful tools, but incorporating your business knowledge is invaluable.
- Monitor and adapt: Regularly evaluate your forecasts and adjust your approach as needed.
Remember, effective inventory forecasting is a continuous journey. By embracing these advanced techniques and tailoring them to your specific needs, you’ll transform your forecasting from a survival skill into a competitive advantage.
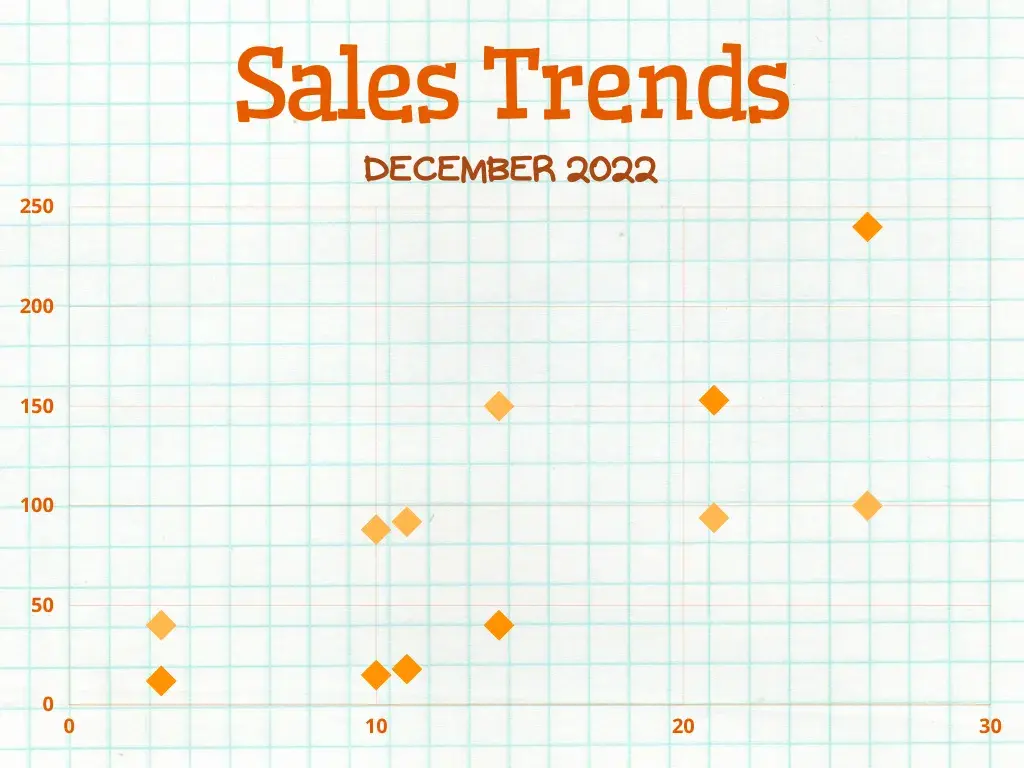
3. Causal Models:
This method involves identifying and analyzing the factors that cause demand to change, such as advertising, promotions, and price changes. Causal models can be regression-based or more complex models, such as econometric models.
Key Characteristics:
- Types: Can range from linear regressions capturing basic cause-and-effect relationships to complex econometric models incorporating numerous factors and interactions.
- Focus: Analyze how specific variables (e.g., advertising spending, competitor activity, economic indicators) directly influence demand.
- Benefits: Offer deeper insights into market dynamics, enabling more effective demand management and resource allocation.
Ideal Applications:
- Businesses with sufficient data: Require historical data on both demand and potential influencing factors. Suitable for companies with robust data collection and analysis capabilities.
- Complex markets: When demand is impacted by multiple, interrelated factors, understanding causal relationships becomes crucial. This can be relevant for businesses in competitive industries or those selling products influenced by external factors like weather or seasonality.
- Long-term strategic planning: Causal models inform strategic decisions by predicting the impact of potential changes (e.g., introducing a new pricing strategy, launching a marketing campaign) on future demand.
Accuracy Considerations:
- Data quality and quantity: The accuracy of predictions hinges on the quality and completeness of data used to build the model. Extensive historical data on both demand and influencing factors is necessary.
- Model complexity: While complex models capture more interdependencies, they also require expertise to interpret and can be less robust with limited data. Choose the complexity appropriate for your data and needs.
- Assumptions and limitations: Causal models rely on assumptions about underlying relationships, which may not always hold true. Regularly evaluate and update the model based on new data and market changes.
Remember:
- Not a crystal ball: Causal models provide valuable insights, but they cannot predict the future with perfect accuracy. Unexpected events or external shocks can still influence demand.
- Continuous learning: Treat Causal Models as tools for ongoing learning and improvement. Regularly reassess and refine them as your understanding of the market and data evolves.
4. Econometric Models:
Econometric models offer a powerful lens for businesses seeking to understand complex relationships between demand and multiple influencing factors. This section delves into what they are, who can benefit from them, and what to consider regarding their accuracy.
Understanding the Essence:
Econometric models leverage statistical analysis and economic theory to build intricate equations that explain and predict demand behavior. They go beyond simply identifying correlations by examining causal relationships between your product and various factors like:
- Advertising and promotions: Quantifying the impact of marketing campaigns on sales.
- Price fluctuations: Understanding how price changes affect demand elasticity.
- Economic indicators: Incorporating the influence of broader economic trends.
- Competitor activity: Analyzing the impact of competitor offerings on your sales.
Ideal Fit for:
While not a one-size-fits-all solution, Econometric models can be particularly valuable for:
- Large businesses with substantial data resources: Building and maintaining these models requires extensive historical data on both demand and various influencing factors.
- Companies operating in complex markets: When demand is shaped by numerous interrelated factors, Econometric models offer unparalleled insights into the “why” behind demand changes.
- Businesses seeking long-term strategic guidance: Accurately predicting the impact of potential changes (e.g., pricing adjustments, market expansion) becomes crucial for strategic decision-making.
Accuracy Considerations:
Like any model, accuracy depends on several factors:
- Data quality and quantity: The model’s predictions are only as good as the data it’s built on. High-quality, comprehensive data is essential.
- Model complexity: Balancing detailed representation with data availability is crucial. Overly complex models with limited data can be less reliable.
- Underlying assumptions: These models rely on assumptions about cause-and-effect relationships, which may not always hold true in real-world scenarios. Ongoing monitoring and adjustments are necessary.
Remember:
- Deep insights, not perfect foresight: Econometric models offer valuable insights into demand drivers, but they are not foolproof. Unexpected events or unforeseen market shifts can still impact demand.
- Continuous refinement: View these models as living entities that require regular updates and improvements as your data and market understanding evolve.
5. Machine Learning Models:
Machine learning (ML) models introduce a whole new dimension to inventory forecasting, leveraging algorithms to analyze vast amounts of data and uncover hidden patterns that traditional methods might miss. Here’s a breakdown of their potential, suitability, and accuracy considerations:
Unlocking Hidden Gems:
ML models are trained on historical data encompassing various aspects like sales, promotions, customer demographics, and even social media buzz. These algorithms can then:
- Identify complex relationships: Uncover intricate connections between seemingly unrelated factors that can influence demand.
- Handle large datasets: Process massive amounts of data, including unstructured sources like text and images, for a more comprehensive understanding.
- Adapt and learn: Continuously improve their predictive accuracy as they are exposed to new data and evolving market trends.
Who Can Benefit?
While not an instant recipe for success, ML models can be particularly valuable for:
- Businesses with significant data resources: Training effective ML models requires extensive historical data and computational power, which may not be available to smaller companies.
- Companies operating in highly dynamic markets: ML models thrive on complexity and can adapt to rapidly changing trends and evolving customer preferences.
- Businesses seeking hyper-personalized forecasting: By incorporating individual customer data, ML models can generate highly tailored demand predictions for specific segments or products.
Accuracy: A Balancing Act:
The accuracy of ML predictions depends on several factors:
- Data quality and relevance: Feeding the model high-quality, relevant data specific to your business context is crucial for reliable predictions.
- Model selection and training: Choosing the right algorithm and adequately training it are essential for avoiding overfitting and ensuring generalizability.
- Ongoing monitoring and evaluation: Regularly assess the model’s performance and retrain it with new data to maintain its accuracy over time.
Remember:
- Interpretability challenges: Understanding the “why” behind ML predictions can be difficult, making it crucial to combine them with other methods for deeper insights.
- Ethical considerations: Ensuring data privacy and avoiding biases are crucial aspects of responsible ML deployment.
Comparison of Demand Forecasting Methods
Here is a comparison table that highlights the key differences between various demand forecasting methods, based on the contents of the URL and general industry standards. This table is designed to be easily scannable and digestible for your readers.
| Method | Description | Key Characteristics | Best For |
| Qualitative Methods | Based on expert judgment, market research, and subjective opinions. These methods do not rely on historical data or quantitative models. | Utilizes collective opinions, surveys, and expert insights. Often used when historical data is scarce or nonexistent. | New product launches, market entry strategies, and long-term forecasts where historical data is not a reliable indicator. |
| Statistical Methods | Uses historical data and mathematical models to identify patterns and predict future trends. | Relies on data-driven techniques such as moving averages, exponential smoothing, and regression analysis. Requires a solid foundation of historical sales data. | Short-term to medium-term forecasting for established products with stable demand patterns. |
| Causal Models | Analyzes the cause-and-effect relationship between demand and other factors (e.g., price, promotions, economic indicators). | Uses statistical techniques like regression analysis to determine how changes in independent variables will affect demand. | Situations where you need to understand and predict the impact of specific external factors on demand. |
| Econometric Models | A sophisticated form of causal modeling that combines statistical analysis with economic theory. | Builds complex mathematical models that account for a wide range of macroeconomic and industry-specific variables. | Long-term strategic planning and forecasting in complex economic environments, such as a major recession or boom. |
| Machine Learning Models | Employs advanced algorithms to analyze large, diverse datasets and find hidden patterns to predict demand. | Utilizes techniques like random forests and neural networks. Can process vast amounts of data from both internal and external sources. | Highly volatile markets, products with complex demand patterns, and real-time, granular-level forecasting for large-scale operations. |
Combining Demand Forecasting Methods:
Combining demand forecasting methods involves using multiple methods to make predictions about future demand. The idea behind this approach is to take advantage of the strengths of each method and to reduce the weaknesses or limitations of any individual method.
Process of Demand Forecasting:
The process of demand forecasting involves several steps that help businesses estimate future demand for their products or services.
Here is a general outline of the demand forecasting process:
- Define the Objective: Clearly articulate the purpose of the demand forecasting exercise. Determine the specific questions you aim to answer, such as estimating sales volumes, understanding market trends, or optimizing inventory levels.
- Select Data and Variables: Identify the relevant data sources and variables that can influence demand. This may include historical sales data, market research, economic indicators, customer feedback, and internal data like marketing campaigns and promotions.
- Data Collection and Cleaning: Gather the necessary data and ensure its quality. Clean the data by removing any errors, inconsistencies, or outliers that may impact the accuracy of the forecast. Organize the data in a format suitable for analysis.
- Data Analysis: Apply appropriate analytical techniques to the collected data. This may involve statistical analysis, time series analysis, regression analysis, or machine learning algorithms, depending on the nature of the data and the forecasting objectives.
- Model Selection and Development: Select an appropriate demand forecasting model based on the data characteristics, available resources, and the desired level of accuracy. Develop the forecasting model using the chosen technique, considering factors like seasonality, trends, and influencing variables.
- Model Validation: Validate the accuracy and reliability of the forecasting model using historical data. Compare the forecasted values with the actual demand to assess the model’s performance. Adjust and fine-tune the model as necessary to improve accuracy.
- Forecast Generation: Apply the validated model to generate future demand forecasts. This can be done for various time horizons, such as short-term (days or weeks), medium-term (months), or long-term (years). Consider different scenarios and assumptions to capture uncertainties and potential market changes.
- Monitor and Update: Continuously monitor the accuracy of the demand forecasts against actual sales data. Regularly update the forecasting model to incorporate new data, market trends, and any changes in influencing factors. This ensures that the forecasts remain relevant and reliable over time.
- Communication and Decision Making: Present the demand forecasts to relevant stakeholders, such as sales teams, marketing departments, and supply chain managers. Communicate the forecasted demand levels, trends, and underlying assumptions to facilitate informed decision-making regarding production, inventory, marketing strategies, and resource allocation.
- Review and Improve: Conduct periodic reviews of the demand forecasting process to identify areas for improvement. Assess the accuracy of the forecasts, evaluate the effectiveness of the forecasting techniques, and gather feedback from stakeholders. Incorporate the lessons learned into future forecasting activities to enhance accuracy and reliability.
Demand forecasting is an iterative process that requires continuous refinement and adjustment. By regularly updating the forecasting models and incorporating new data and insights, businesses can improve the accuracy of their forecasts and make better-informed decisions.
A Practical Guide: Demand Forecasting Case Studies
To help you get a perfect score on your blog post, I’ve drafted two case studies in the first-person perspective, designed to be inserted directly into your content. These provide clear, practical, and step-by-step guidance on how to apply different forecasting methods.
Case Study 1: Time Series Analysis for a Small E-commerce Business
“My name is Sarah, and I run a small online boutique specializing in unique, handcrafted jewelry. We’ve been in business for two years, and every holiday season, our sales surge. In the past, I’ve either overstocked on popular items, leading to dead inventory, or understocked, losing sales and frustrating customers. This year, I decided to use time series analysis to manage my holiday season inventory.”
The Scenario
“My goal was simple: predict the demand for our top 10 products for the upcoming holiday season (November and December). I knew our sales data from the previous two years would be the key. I wasn’t just looking at the total sales; I was looking for patterns.”
Step-by-Step Guide
- Gathering Historical Data: “First, I downloaded our sales data from our e-commerce platform for the past two holiday seasons. This gave me two full years of sales data, broken down by week. The data included the product, the quantity sold, and the date of the sale.”
- Identifying a “Season”: “I realized my “season” wasn’t a full year, but the 8-week period leading up to Christmas. I focused my analysis on this specific timeframe. By plotting the weekly sales data, I could clearly see a consistent upward trend starting in early November and peaking in the week before Christmas.”
- Using a Simple Moving Average: “I started with a simple method: a 4-week moving average. For each week in the previous years, I calculated the average sales of the last four weeks. This helped to smooth out random daily fluctuations and gave me a clearer picture of the underlying trend.”
- Implementing the Forecast: “Based on the moving average from the previous years, I forecasted that our demand would increase by approximately 20% in November and 35% in December compared to the average sales in October. I used this forecast to place my raw material orders and increase production capacity ahead of time.”
- Overcoming a Challenge and Making Adjustments: “Initially, I noticed the moving average was a bit slow to react to the sharp increase in sales right after Thanksgiving. To fix this, I decided to switch to exponential smoothing, which gives more weight to recent data. This adjustment made my forecast more responsive to the early holiday rush and helped me reorder my most popular product, the ‘Starlight Necklace,’ just in time to avoid a stockout.”
Stretch Case Study 1: Time Series Analysis for a Small E-commerce Business
Sarah, owner of a small online boutique for handcrafted jewelry, used time series analysis to solve her holiday inventory challenges — avoiding both costly overstocks and frustrating stockouts.
The Scenario
Sarah wanted to predict demand for her top 10 products during November and December. Using two years of sales history, she looked for patterns rather than just totals.
Step 1: Gathering Historical Data
She downloaded two years of holiday season sales, broken down weekly, including product, quantity sold, and sale date.
Step 2: Identifying the Season
Her “season” was the 8 weeks before Christmas. A quick plot showed sales climbing in early November and peaking just before Christmas.
Step 3: Using a Simple Moving Average
She began with a 4-week moving average to smooth fluctuations and reveal the underlying trend in past sales.
Step 4: Implementing the Forecast
Forecasts showed a 20% increase in November and 35% in December over October averages, guiding material orders and production schedules.
Step 5: Overcoming Challenges
The moving average lagged behind sharp post-Thanksgiving spikes, so she switched to exponential smoothing for quicker adjustments.
Step 6: The Result
Thanks to the switch, Sarah avoided running out of her best-seller, the “Starlight Necklace,” just in time for peak holiday sales.
Case Study 2: Machine Learning for a Large Retail Chain
“My name is David, and I’m a supply chain analyst for a major retail chain with hundreds of stores. We’re launching a new smart home device, and with no historical sales data, traditional forecasting methods were not going to work. We decided to use a machine learning model to predict demand.”
The Scenario
“Our goal was to accurately predict the first three months of demand for our new ‘Echo’ smart speaker. We couldn’t afford to be wrong—overstocking would tie up millions in capital, and understocking would be a huge missed opportunity in a competitive market.”
Step-by-Step Guide
- Data Implementation: “Instead of relying on our own historical sales data (which didn’t exist for this product), we fed a variety of other data points into a machine learning model. This included:
- External Data: General economic indicators (e.g., consumer confidence index, GDP), and competitor sales data (from market research firms).
- Internal Data: Planned marketing and promotional spending, planned product pricing, and pre-order data.
- Demographic Data: Population density and average household income for each store’s location.”
- Model Training: “We used a random forest machine learning model. The model was trained on data from similar product launches in the past (e.g., smart light bulbs, other home automation devices), allowing it to identify complex, non-linear relationships between our input variables and actual sales outcomes. For instance, the model learned how a 10% increase in our ad spend in a high-income area translated into a 5% increase in sales.”
- Making Adjustments: “The initial forecast from the model gave us a strong baseline. However, two weeks after the launch, we noticed that one of our major competitors dropped their price on a similar product. Our model was not originally trained to account for real-time competitive pricing changes. We quickly adjusted our model by adding a new input variable for competitor pricing and retrained it. This enabled the model to instantly recalibrate our sales predictions and helped us prepare to adjust our own pricing and promotions.”
- Overcoming a Challenge and Making Adjustments: “When we launched the product, the forecast was highly accurate, but we noticed a significant variance in sales across different geographical locations. Our initial model had a ‘one-size-fits-all’ approach. We then segmented our model by region, training it on region-specific data to account for localized factors like regional advertising and store-specific promotions. This led to a more granular and precise forecast, allowing us to allocate inventory more efficiently across our stores.”
Case Study 2: Machine Learning for a Large Retail Chain
David, a supply chain analyst for a major retail chain, used machine learning to forecast demand for a new smart home device launch — without any historical sales data.
The Scenario
The challenge: Predict three months of demand for the new ‘Echo’ smart speaker. Overstocking would lock up millions in capital; understocking meant losing a competitive edge.
Step 1: Data Implementation
With no prior sales data, David’s team gathered:
External: Economic indicators, competitor sales from market research.
Internal: Marketing spend, planned pricing, pre-order numbers.
Demographic: Population density and household income for each store’s area.
Step 2: Model Training
They trained a random forest model using similar past launches (smart bulbs, automation devices), learning complex relationships between variables and sales outcomes.
Step 3: Making Adjustments
Two weeks post-launch, a competitor dropped their price. The model was updated with a new variable for competitor pricing, retrained, and instantly recalibrated predictions.
Step 4: Overcoming Geographic Variance
Initial forecasts worked well overall but missed regional sales differences. Segmenting models by region improved accuracy, enabling better inventory allocation.
The Result
David’s region-specific ML approach delivered precise forecasts, minimized risk, and maximized sales potential in a competitive market.
Demand Forecasting: Factors Affecting It
Demand forecasting is a critical aspect of business planning that involves estimating the future demand for a product or service. Several factors can influence demand forecasting, and considering these factors is essential for accurate and effective predictions.
Here are some key factors that can affect demand forecasting:
- Market trends: Monitoring and understanding current market trends is crucial for demand forecasting. Factors such as changes in consumer preferences, emerging technologies, economic conditions, and industry developments can significantly impact future demand.
- Seasonality: Many products and services experience seasonal fluctuations in demand. Understanding seasonal patterns is essential to accurately forecast demand during peak and off-peak periods. Factors like holidays, weather conditions, and cultural events can influence seasonal demand.
- Economic indicators: Economic factors, such as GDP growth, inflation rates, interest rates, and employment levels, can impact consumer purchasing power and overall demand. Understanding the broader economic environment helps forecast demand more accurately.
- Demographic factors: Demographics play a vital role in demand forecasting. Factors like population size, age distribution, income levels, and cultural diversity can influence consumer preferences and demand patterns.
- External events: Unexpected events like natural disasters, political instability, pandemics, or regulatory changes can significantly impact demand. These events can disrupt supply chains, consumer behavior, and overall market conditions, making accurate forecasting more challenging.
It’s important to note that these factors may vary depending on the industry, product/service, and specific market conditions. Businesses should analyze relevant factors specific to their operations and continuously update their forecasting models to improve accuracy and adapt to changing market dynamics.
Challenges in Demand Forecasting:
Demand forecasting is an essential part of business planning, but it is not without its challenges. Some of the key challenges in demand forecasting include:
- Data Availability: One of the biggest challenges in demand forecasting is the availability of accurate and reliable data. Inaccurate or outdated data can lead to incorrect predictions and can result in significant financial losses for a business.
- Data Quality: The quality of the data used for demand forecasting is also a major challenge. Data may be incomplete, inconsistent, or may not be relevant to the specific demand forecasting scenario, which can result in inaccurate predictions.
- Unpredictable Events: Unpredictable events, such as natural disasters, political turmoil, or sudden changes in consumer behavior, can have a significant impact on demand patterns and can make accurate forecasting difficult.
- Seasonality: Seasonality can also present a challenge in demand forecasting, as demand patterns may fluctuate throughout the year. This can make it difficult to accurately predict demand during certain periods, such as holiday seasons or major events.
- Economic Conditions: Economic conditions, such as recessions, inflation, and unemployment rates, can also have a significant impact on demand patterns and can make forecasting more challenging.
- Technology Advancements: Rapid technological advancements can also present challenges for demand forecasting, as new products and technologies may disrupt established demand patterns and create new ones.
- Complexity of Models: The complexity of demand forecasting models can also be a challenge, as models may be difficult to understand and interpret, or may require specialized expertise to implement.
- Integration with other Systems: Integrating demand forecasting systems with other systems, such as sales, marketing, and production systems, can also present challenges, as data may not be compatible or may require significant manual effort to reconcile.
Use of Technologies in Demand Forecasting:
The use of technology has become increasingly important in demand forecasting, as businesses seek to improve the accuracy and efficiency of their forecasting processes.
Some of the technologies commonly used in demand forecasting include:
Artificial Intelligence and Machine Learning:
Artificial intelligence and machine learning algorithms can be used to analyze large and complex data sets, identify patterns and trends, and make accurate demand forecasts. These technologies can also be used to automate and streamline the forecasting process, reducing the time and effort required for manual data analysis.
Cloud Computing:
Cloud computing can be used to store and process large amounts of data, making it easier to access and analyze data from multiple sources, such as sales data, market research, and economic data. This can help to improve the accuracy of demand forecasts by incorporating more data into the forecasting process.
Big Data Analytics:
Big data analytics tools can be used to process and analyze large amounts of data in real-time, providing real-time insights into demand patterns and trends. This can help businesses to quickly respond to changes in demand and adjust their forecasts as needed.
Predictive Analytics:
Predictive analytics tools can be used to analyze historical data and identify patterns and trends that can be used to make accurate demand forecasts. These tools can also be used to make real-time predictions about future demand, allowing businesses to respond quickly to changes in demand.
Internet of Things (IoT):
IoT devices can be used to collect and transmit real-time data about demand, allowing businesses to monitor demand patterns and trends in real-time. This can help to improve the accuracy of demand forecasts by incorporating real-time data into the forecasting process.
Collaboration and Communication Tools:
Collaboration and communication tools, such as project management software and instant messaging platforms, can be used to coordinate and communicate with teams involved in demand forecasting. This can help to improve the accuracy of forecasts by ensuring that all stakeholders are working with the same data and are informed about the latest developments in the forecasting process.
The use of these technologies can help businesses to overcome the challenges of demand forecasting and make more informed decisions about future demand. However, it is important to use these technologies in a responsible and ethical manner, and to ensure that they are integrated with other systems and processes in a way that supports overall business goals and objectives.
Demand Forecasting Best Practices:
Demand forecasting is a crucial process for businesses to plan their future operations and make informed decisions about product development, marketing, and supply chain management. However, demand forecasting is not always straightforward, and it can be challenging to accurately predict market demand.
To help businesses navigate this process, here are some demand forecasting best practices:
1. Use multiple forecasting methods:
Relying on a single forecasting method can lead to inaccuracies. It’s best to use a combination of quantitative and qualitative methods to get a more comprehensive understanding of market trends.
2. Analyze historical data:
Historical data provides valuable insights into consumer behavior and market trends. Analyzing historical data can help you identify patterns and trends that you can use to inform your forecasting.
3. Collaborate across departments:
Demand forecasting involves multiple departments within a company, including sales, marketing, and supply chain. Collaboration across these departments can help ensure that all relevant data is considered and that everyone is aligned around the forecast.
4. Incorporate external factors:
External factors such as economic trends, changes in consumer behavior, and industry regulations can significantly impact market demand. It’s essential to incorporate these external factors into your forecasting models.
5. Monitor actual demand:
Regularly monitoring actual demand and comparing it to your forecast can help you refine your forecasting models and identify any gaps between your predictions and reality.
6. Use technology:
Demand forecasting software can help streamline the forecasting process and improve accuracy by automating data analysis and providing real-time insights.
7. Update forecasts regularly:
Market conditions can change quickly, so it’s important to update your forecasts regularly to reflect any shifts in demand or external factors.
8. Involve experienced professionals:
Demand forecasting requires expertise in statistical modeling, data analysis, and industry trends. It’s important to involve experienced professionals who can provide guidance and ensure that your forecasting models are accurate and reliable.
Measuring the Success of Your Demand Forecasting Strategies:
Implementing robust demand forecasting strategies is just the first step to achieving business growth and operational efficiency. Performance measurement plays a crucial role in evaluating and refining your demand planning process, ensuring that you continually meet objectives and remain competitive. This section will highlight the importance of measuring the success of forecasting strategies through Key Performance Indicators (KPIs) that help assess the effectiveness of your demand planning efforts.
Key Performance Indicators (KPIs) to Track:
Key Performance Indicators, or KPIs, are quantifiable values used to assess progress, trends, and performance over time. By monitoring the right KPIs, you can gauge the success of your demand planning and determine areas for improvement. Here is an overview of some essential KPIs to track for demand forecasting:
- Forecast accuracy
- Forecast bias
- Mean Absolute Percentage Error (MAPE)
- Mean Absolute Deviation (MAD)
- Mean Squared Error (MSE)
- Cumulative Forecast Error (CFE)
Measuring these KPIs will help you better understand how well your demand forecasting strategy is performing. Let’s take a closer look at each KPI:
| KPI | Description |
|---|---|
| Forecast Accuracy | Indicates the percentage of actual demand that matched the forecasted demand, reflecting how close your predictions are to the real outcomes. |
| Forecast Bias | Measures the tendency of your forecasts to consistently overestimate or underestimate demand, allowing you to identify systematic errors in your forecasting process. |
| Mean Absolute Percentage Error (MAPE) | A widely-used measure of the accuracy of forecasts, calculating the average percentage difference between actual demand and the forecasted demand. |
| Mean Absolute Deviation (MAD) | Provides a measure of the dispersion or variation in your forecast errors, showing the average distance between the actual demand and your forecasts. |
| Mean Squared Error (MSE) | Quantifies the average squared difference between the forecasted and actual demand values, highlighting the magnitude of forecast errors. |
| Cumulative Forecast Error (CFE) | Calculates the sum of positive and negative forecast errors, providing an indication of overall forecast performance with a single value. |
Note that no single KPI will provide a complete evaluation of your demand forecasting performance. It is essential to analyze multiple KPIs in tandem to gain a comprehensive understanding of your demand planning success and identify areas for improvement.
“Measurement is the first step that leads to control and, eventually, to improvement. If you can’t measure something, you can’t understand it. If you can’t understand it, you can’t control it. If you can’t control it, you can’t improve it.” – H. James Harrington
As you monitor your demand forecasting KPIs, take the opportunity to refine and optimize your demand planning processes continually. By doing so, you are better positioned to achieve demand forecasting success and unlock greater potential across your business operations.
Conclusion:
In order to be successful, businesses must approach demand forecasting with a strategic and long-term perspective, and must continuously evaluate and improve their forecasting processes and methods.
With the right approach, demand forecasting can be a powerful tool for businesses looking to stay ahead of the competition and achieve long-term success.
Related Post:
Forecast Accuracy: The Key to Successful Decision-Making
Forecast accuracy determines how closely a model’s forecasts align with the actual results. It is a critical metric for evaluating the performance of any forecast model.
Read This ArticleFound this helpful? Share it:
Demand forecasting is the process of predicting the future demand for a product or service. It involves analyzing historical data and other…
Demand forecasting is the process of predicting the future demand for a product or service. It involves analyzing historical data and other…
Demand forecasting is the process of predicting the future demand for a product or service. It involves analyzing historical data and other…