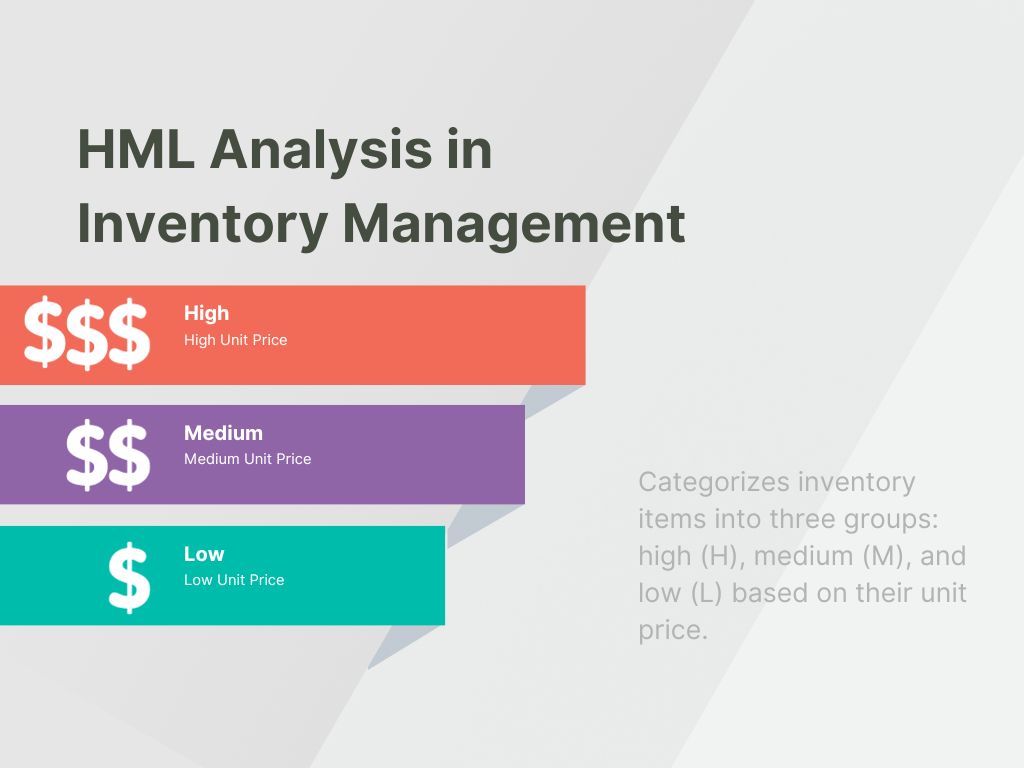
HML analysis, an inventory classification technique, categorizes inventory items into three groups: high (H), medium (M), and low (L) based on their unit price.
This simple yet effective method provides businesses with a structured approach to inventory management, enabling them to prioritize control efforts based on item value.
Classifying Inventory Items:
To classify inventory items into H, M, and L categories, businesses typically establish three price ranges.
Items with the highest unit prices fall into the H category, representing the most expensive items in the inventory. Items with medium unit prices are classified as M, while items with the lowest unit prices fall into the L category.
Rationale Behind Unit Price-Based Classification:
The rationale behind classifying inventory items based on unit price stems from the principle of Pareto optimality, also known as the 80/20 rule. This principle suggests that a relatively small percentage of items (typically 20%) account for a significant portion of the total inventory value (typically 80%).
By focusing control efforts on the high-value items, businesses can minimize the risk of stockouts for critical components while reducing the administrative burden associated with managing low-value items.
Typical Distribution of Items in H, M, and L Categories:
The distribution of inventory items across the H, M, and L categories follows a general pattern.
Typically, H items represent around 10-15% of the total inventory count but account for a substantial portion of the total inventory value, often 60-70%. M items represent a larger portion of the count, typically 20-25%, and contribute a significant share of the value, around 20-30%. L items, representing the most numerous group, typically account for 60-70% of the count but contribute the least to the total value, often 10-15%.
This distribution pattern highlights the importance of prioritizing control efforts on H items, as they have the greatest impact on the overall inventory value and business operations. By ensuring adequate stock levels and minimizing the risk of stockouts for H items, businesses can protect their revenue streams and maintain operational efficiency.
HML Inventory Classification Framework
HML analysis categorizes inventory items into High, Medium, and Low value groups based on their unit price. This simple yet effective method helps businesses focus control efforts where they matter most.
H Items — High Unit Price
The most expensive items, typically 10–15% of total inventory count but representing 60–70% of total inventory value.
- Examples: Precision machinery, premium raw materials, critical electronic components
- Policy Tips: Maintain tight control, ensure availability, minimize stockouts, and review demand regularly
M Items — Medium Unit Price
Mid-range value items, typically 20–25% of total count, contributing around 20–30% of total inventory value.
- Examples: Standard machinery parts, common raw materials, mid-tier finished goods
- Policy Tips: Monitor trends, adjust safety stock as needed, balance cost with availability
L Items — Low Unit Price
The most numerous items (60–70% of count) but only 10–15% of total value — low financial impact individually.
- Examples: Nuts, bolts, basic packaging materials, low-cost office supplies
- Policy Tips: Simplify ordering, minimize admin effort, consider bulk buying for efficiency
Benefits of HML Analysis:
HML analysis offers a multitude of benefits for businesses seeking to optimize their inventory management practices. By categorizing inventory items based on unit price,
HML analysis provides a structured approach to inventory control, enabling businesses to make informed decisions regarding stock levels, purchasing strategies, and resource allocation.

1. Improved Inventory Control and Reduced Risk of Stockouts or Overstocks:
HML analysis plays a crucial role in preventing stockouts and overstocks, two common inventory management challenges. By prioritizing control efforts on H items, businesses can effectively minimize the risk of stockouts for critical components, ensuring that essential products are always available to meet customer demand. This approach also helps to reduce the likelihood of overstocks for low-value items, preventing unnecessary carrying costs and storage space utilization.
2. Enhanced Efficiency in Inventory Management Processes:
HML analysis streamlines inventory management processes by providing a clear understanding of the inventory cost structure. By focusing attention on the most valuable items, businesses can simplify inventory tracking, control procedures, and purchasing decisions. This targeted approach reduces administrative burdens and improves overall efficiency in inventory management.
3. Optimized Resource Allocation for Inventory-Related Activities:
HML analysis enables businesses to allocate resources more effectively for inventory-related activities. By identifying the items that require the most attention, businesses can prioritize stock verification efforts, safety stock levels, and procurement strategies. This optimization of resources ensures that critical items are adequately managed while minimizing the effort spent on low-value items.
4. Better Decision-Making Regarding Inventory Levels and Purchasing Strategies:
HML analysis provides businesses with valuable insights into their inventory portfolio, enabling them to make informed decisions regarding stock levels and purchasing strategies. By understanding the cost structure and usage patterns of different inventory items, businesses can optimize their ordering quantities, reorder points, and safety stock levels. This data-driven approach reduces the risk of stockouts, overstocks, and excessive carrying costs.
5. Streamlined Inventory Reporting and Analysis:
HML analysis facilitates streamlined inventory reporting and analysis. By classifying items into H, M, and L categories, businesses can easily generate reports that provide a clear overview of inventory status, usage trends, and cost structure. This simplified reporting enables managers to make informed decisions and identify areas for potential improvement.
6. Enhanced Inventory Visibility and Control:
HML analysis enhances inventory visibility by providing a clear categorization of items based on their value. This categorization allows businesses to quickly identify critical items that require close monitoring and control. By focusing attention on H items, businesses can proactively address potential stockouts and ensure that these critical components are always available.
7. Improved Inventory Turnover and Reduced Carrying Costs:
HML analysis can help businesses improve inventory turnover and reduce carrying costs. By identifying slow-moving items, businesses can implement strategies to accelerate their movement, such as discounts or promotions. This optimization of inventory turnover reduces the time and resources spent on storing and managing low-value items, leading to lower carrying costs.
8. Enhanced Customer Satisfaction and Reduced Out-of-Stock Incidents:
HML analysis contributes to enhanced customer satisfaction by minimizing the risk of stockouts for critical items. By ensuring that essential products are always available, businesses can meet customer demand promptly, reducing the likelihood of customer frustration and lost sales.
9. Improved Supply Chain Management and Collaboration:
HML analysis can be integrated into supply chain management processes to enhance collaboration and communication between suppliers and distributors. By sharing inventory data and categorization, businesses can better coordinate purchasing strategies and ensure that critical components are always available throughout the supply chain network.
10. Continuous Improvement and Optimization of Inventory Management:
HML analysis provides a framework for continuous improvement in inventory management practices. By regularly reviewing inventory data and analyzing usage patterns, businesses can identify areas for optimization and refine their control strategies. This ongoing evaluation ensures that inventory management remains aligned with business goals and objectives.
Applications of HML Analysis:
HML analysis, an inventory classification technique, finds applications across a wide range of industries, including manufacturing, retail, and healthcare. Its versatility and adaptability make it a valuable tool for businesses of all sizes seeking to optimize their inventory management practices.
1. Manufacturing:
- Identifying critical components and prioritizing stock control efforts
- Optimizing purchasing strategies for high-value components
- Reducing carrying costs for low-value items
- Streamlining inventory tracking and control procedures
- Enhancing supply chain management and collaboration
2. Retail:
- Preventing stockouts for critical products and minimizing sales losses
- Optimizing product assortments and managing slow-moving items
- Reducing inventory carrying costs and improving margins
- Enhancing customer satisfaction by ensuring product availability
- Streamlining inventory replenishment and ordering processes
3. Healthcare:
- Ensuring adequate stock levels of critical medical supplies and medications
- Optimizing inventory turnover and reducing expiration risks
- Managing controlled substances and high-value medical equipment
- Streamlining inventory tracking and control procedures in complex healthcare settings
- Enhancing patient safety by minimizing the risk of stockouts
4. Other Applications:
- Inventory management in warehouses and distribution centers
- Managing spare parts and consumables in service-oriented businesses
- Optimizing inventory levels in rental businesses
- Tracking and controlling inventory in government agencies and non-profit organizations
5. Adaptability to Different Inventory Sizes:
HML analysis can be effectively applied to businesses with varying inventory sizes, from small retail shops to large manufacturing plants. The simplicity of the classification method makes it scalable to different inventory levels and complexities.
6. Integration with Inventory Management Systems:
HML analysis can be integrated with existing inventory management systems to provide a comprehensive approach to inventory control. The classification data can be seamlessly incorporated into inventory management software, enhancing reporting and analysis capabilities.
7. Continuous Monitoring and Review:
HML analysis is not a static exercise; it requires continuous monitoring and review to adapt to changing business conditions and inventory patterns. Regular updates to inventory data and classification ensure that the control strategies remain effective and aligned with business goals.
Implementation of HML Analysis:
Implementing HML (high, medium, low) analysis involves a systematic approach to categorizing inventory items based on their unit price and developing appropriate control mechanisms for each category. Here’s a step-by-step guide to implementing HML analysis:

Step 1: Gather Inventory Data
Begin by gathering comprehensive inventory data, including item descriptions, unit prices, stock levels, and usage rates. This data can be obtained from inventory management systems, purchase records, and physical stock counts.
Step 2: Establish Price Ranges
Define price ranges for the H, M, and L categories based on the distribution of unit prices within the inventory. The specific ranges may vary depending on the industry and business context.
Step 3: Classify Inventory Items
Assign each inventory item to its corresponding H, M, or L category based on its unit price. This classification can be done manually or using automated tools integrated with inventory management systems.
Step 4: Establish Control Mechanisms
Develop different control mechanisms for each inventory category. For H items, prioritize frequent stock verification, tight safety stock levels, and proactive purchasing strategies. For M items, implement regular stock checks, moderate safety stock levels, and strategic purchasing plans. For L items, consider less frequent stock verification, lower safety stock levels, and opportunistic purchasing approaches.
Step 5: Continuously Monitor and Update
Establish a process for continuously monitoring inventory data, usage patterns, and market conditions. Periodically review the classification of items to ensure it remains accurate and reflects changes in the inventory portfolio. Update control mechanisms as needed to maintain optimal inventory levels and minimize costs.
Additional Considerations:
- Integrate with Inventory Management Systems: Utilize inventory management software to integrate HML classification data and automate control mechanisms.
- Train Inventory Personnel: Provide training to inventory personnel on HML analysis principles and the implementation of control strategies.
- Measure and Evaluate Impact: Regularly measure the impact of HML analysis on inventory turnover, carrying costs, and stockout rates.
Benefits of Implementing HML Analysis:
- Improved inventory control and reduced risk of stockouts or overstocks
- Enhanced efficiency in inventory management processes
- Optimized resource allocation for inventory-related activities
- Better decision-making regarding inventory levels and purchasing strategies
- Enhanced inventory visibility and control
- Improved inventory turnover and reduced carrying costs
- Enhanced customer satisfaction and reduced out-of-stock incidents
- Improved supply chain management and collaboration
- Continuous improvement and optimization of inventory management
Practical Examples and Statistical Context
While the general principles of HML analysis are a great starting point, a truly effective implementation requires a deeper dive into the numbers. To move beyond theory, let’s explore some practical examples and the statistical basis behind the typical distributions.
A Concrete Example: XYZ Retail Store
Imagine a small retail store, XYZ Retail, with 100 different inventory items. We’ve classified them based on their unit price to perform an HML analysis.
| Category | Number of Items (Count) | Percentage of Total Items | Total Value (per unit price) | Percentage of Total Value |
| High (H) | 10 | 10% | $70,000 | 70% |
| Medium (M) | 20 | 20% | $20,000 | 20% |
| Low (L) | 70 | 70% | $10,000 | 10% |
| Total | 100 | 100% | $100,000 | 100% |
In this example, the H items are a small percentage of the total items (10%) but represent the vast majority of the inventory’s value (70%). These are the high-priority items that require tight control. The L items, on the other hand, are the most numerous (70%) but contribute the least to the total value (10%), so they require less intensive management.
The Statistical Basis: Connecting HML to the Pareto Principle
The typical distribution of items across H, M, and L categories is a direct application of the Pareto Principle, also known as the 80/20 rule. This principle states that roughly 80% of the effects come from 20% of the causes. In the context of HML analysis, this means that a small percentage of your inventory items account for a large percentage of your inventory’s total value.
While the exact percentages (e.g., 80/20, 70/20/10) can vary by industry and business, the fundamental concept remains the same: not all inventory is created equal. The power of HML analysis lies in this statistical understanding, allowing businesses to focus their limited time and resources where they will have the greatest impact on profitability and operational efficiency.
The Limitations of HML Analysis
While HML analysis is a powerful and easy-to-implement tool, it’s essential to recognize its limitations. The primary drawback is its sole reliance on unit price. This can create blind spots in your inventory management strategy if not used in conjunction with other metrics.

Consider the following scenarios where relying only on unit price could be misleading:
- Critical Low-Cost Items: A tiny, inexpensive screw might be classified as an L item, but if it’s a vital component that stops your entire production line when it’s out of stock, its importance far outweighs its price.
- High-Cost, Low-Demand Items: A specialized, high-priced part classified as an H item might have very low demand. Applying tight controls and high safety stock to this item might lead to unnecessary carrying costs and a large amount of capital being tied up in an item that rarely sells.
For a truly robust inventory management system, HML analysis is often combined with other classification methods, such as ABC analysis (based on consumption value) or VED analysis (based on criticality). By integrating these methods, you can gain a more comprehensive view of your inventory and make decisions that are both cost-effective and operationally sound.
Integrating HML with Other Inventory Classification Methods
To overcome the limitations of HML analysis and achieve a truly holistic view of your inventory, it’s a best practice to combine it with other classification systems. This multi-faceted approach allows you to prioritize items based on multiple criteria, not just unit price.
| Analysis Type | Primary Criterion | Key Question It Answers | Best Use Case |
| HML | Unit Price | How much does each item cost? | Prioritizing inventory based on a simple, direct value. |
| ABC | Annual Consumption Value ($) | How much total value does an item contribute to the business over time? | Focusing on the most profitable items and their turnover. |
| VED | Vital, Essential, Desirable | How critical is this item to operations? | Ensuring that mission-critical items are always in stock, regardless of cost. |
| FSN | Fast, Slow, Non-moving | How quickly does this item move out of inventory? | Identifying obsolete stock and managing storage space. |
By cross-referencing these analyses, you can create a more nuanced strategy. For example, an item might be classified as L (low cost) but also V (vital). In this case, you would manage it with the same urgency as an H item to prevent costly operational shutdowns. Similarly, a high-cost H item that is also S (slow-moving) might be a candidate for a targeted promotion or markdown to free up capital and warehouse space. This integrated approach ensures that you’re making smarter, more informed decisions about every item in your inventory.
Conclusion:
HML analysis, while a simple concept, provides a powerful and accessible foundation for businesses looking to gain control over their inventory. By systematically categorizing items based on their unit price, it helps to demystify complex stock portfolios and enables a targeted approach to management.
The core strength of the HML framework lies in its practicality:
- Focus on the High-Impact Items: It immediately directs attention and resources to the items that represent the most significant financial value, safeguarding your capital and revenue streams.
- Rationalize Effort: It allows you to right-size your management efforts, preventing the over-management of low-cost items while ensuring that critical, high-value items receive the attention they deserve.
- A Starting Point for Further Analysis: As we’ve discussed, HML is not the end-all solution but a vital first step. It serves as an excellent entry point for businesses new to inventory analysis and can be easily integrated with more sophisticated techniques like ABC, VED, or FSN analysis as your operations grow in complexity.
Ultimately, HML analysis is a tool for making smarter, more strategic decisions. By understanding what you have, what it’s worth, and where to focus your energy, you can optimize your inventory, reduce costs, and build a more resilient and profitable business.
Found this helpful? Share it:
HML analysis, an inventory classification technique, categorizes inventory items into three groups: high (H), medium (M), and low (L) based on their…
HML analysis, an inventory classification technique, categorizes inventory items into three groups: high (H), medium (M), and low (L) based on their…
HML analysis, an inventory classification technique, categorizes inventory items into three groups: high (H), medium (M), and low (L) based on their…