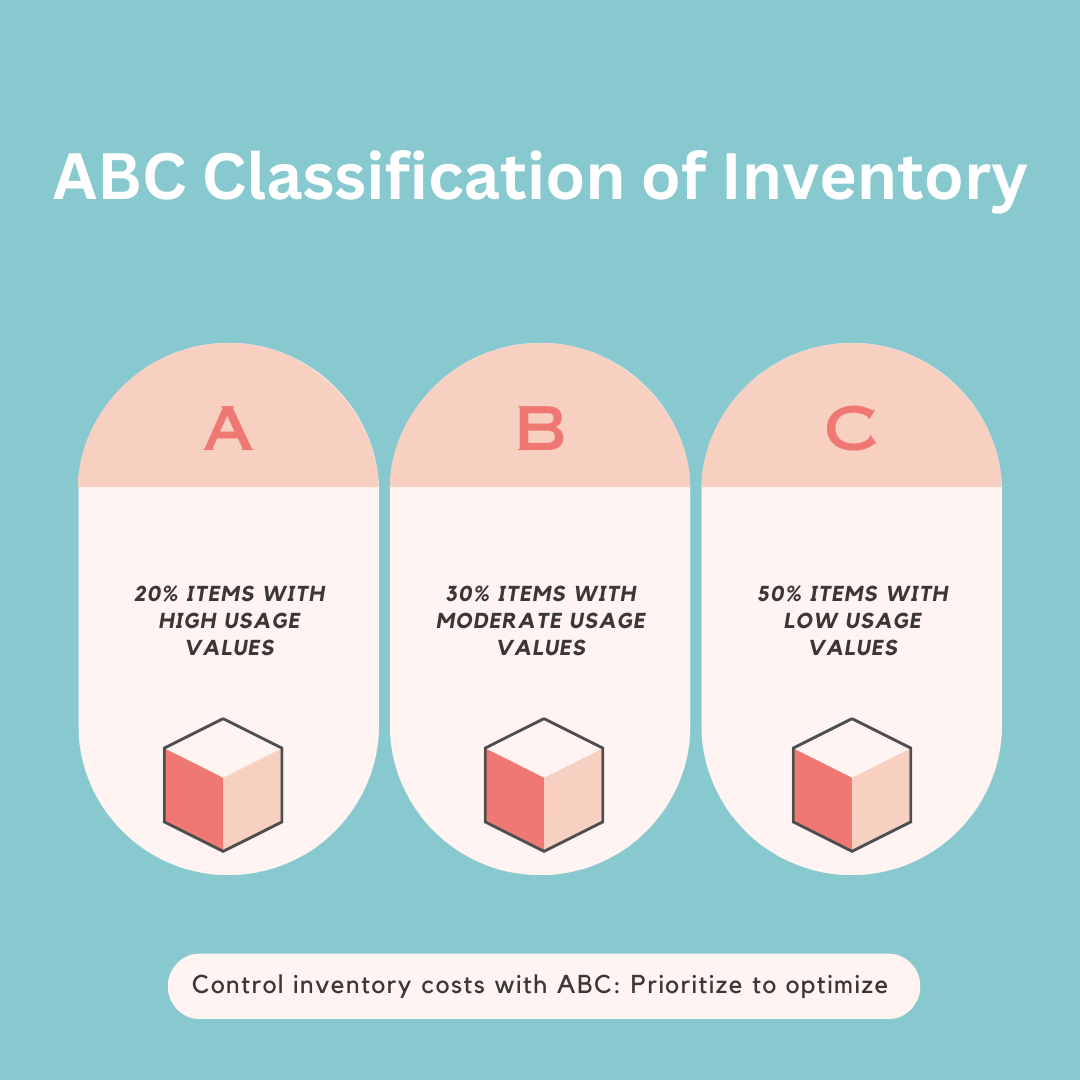
ABC analysis is an inventory management technique that categorizes items into three groups (A, B, and C) based on their value and importance to the business.
“A” items are high-value, requiring tight control and accurate records, while “C” items are low-value, needing minimal control and record-keeping. “B” items fall in between. This helps businesses optimize resource allocation and inventory management strategies.
The purpose of ABC analysis is to allow companies to focus their efforts and resources on the most valuable items, while still managing the rest of the inventory efficiently. It helps organizations to optimize their inventory management processes and make better use of their resources, reducing the risk of stock shortages and overstocking.
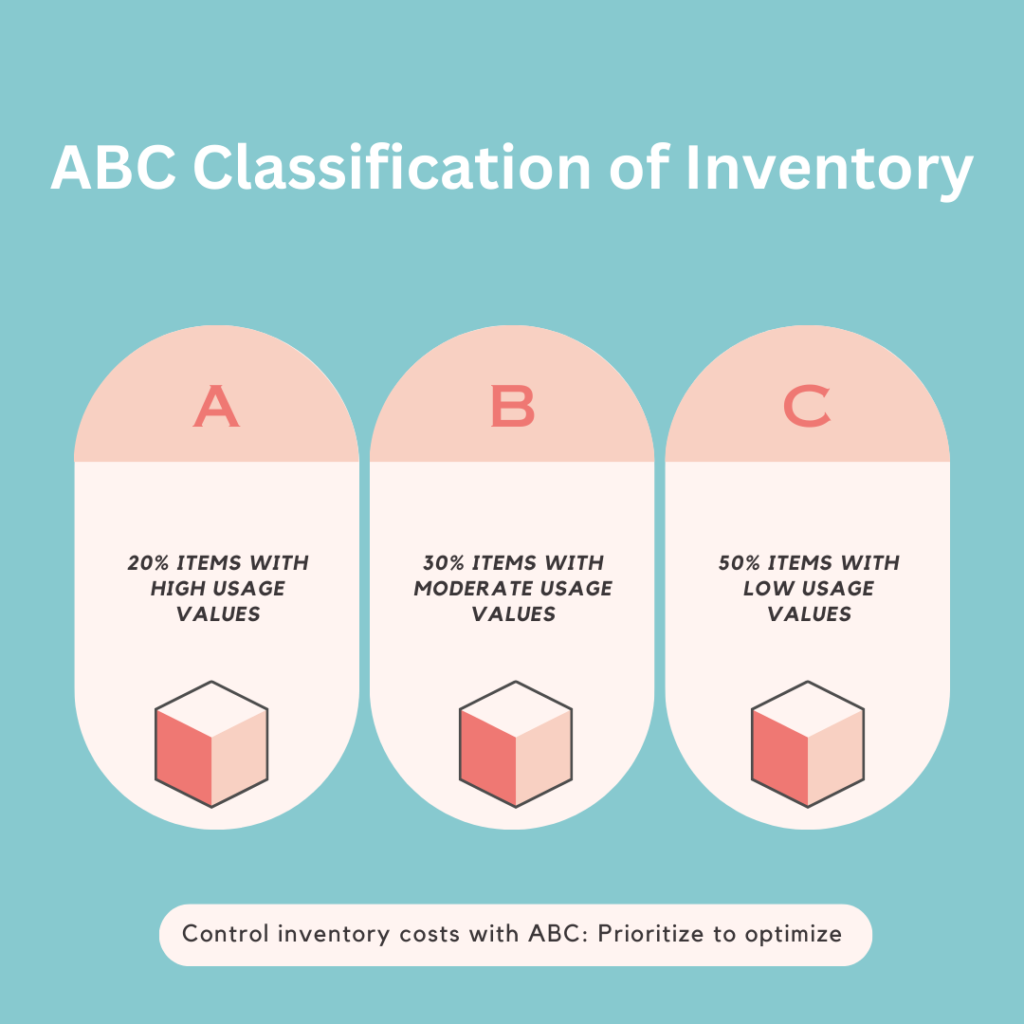
Pareto Principle & ABC Classifications:
The Pareto Principle, named after the Italian economist Vilfredo Pareto, was first introduced in the late 19th century. Pareto observed that approximately 80% of the land in Italy was owned by 20% of the population. He later expanded this observation to other areas of economics, including the distribution of wealth and income.
Pareto noticed that this 80/20 distribution was present in many other areas of life and coined the term “Pareto principle” to describe it. Over time, the principle has been applied to various fields, such as project management, quality control, and marketing, where it can be used to identify and prioritize the most important factors that contribute to a particular outcome.
For example, in business, the Pareto Principle suggests that 80% of a company’s sales may come from 20% of its customers, or that 80% of a company’s profits may come from 20% of its products. By applying this principle, companies can prioritize their efforts and allocate resources to the most impactful areas.
Purpose of Using ABC Analysis in Inventory Management:
Effective inventory management hinges on allocating time, attention, and resources to the items that matter most. ABC analysis offers a structured, data-driven approach by categorizing stock-keeping units (SKUs) into three tiers—“A”, “B”, and “C”—based on their annual consumption value. Here’s how leveraging ABC analysis can transform your inventory control:
1. Maximize Return on Investment
- Focus on High-Value “A” Items
“A” items typically account for a small fraction of the SKU count (around 10–20%) but contribute the lion’s share of inventory value (roughly 70–80%). By dedicating rigorous demand forecasting, tighter safety stock thresholds, and frequent review cycles to these items, you ensure capital is tied up where it drives the greatest profitability. - Example: A manufacturer’s top-selling engine part may warrant daily stock checks and multiple supplier contracts to guard against any disruption.
2. Minimize Inventory Carrying Costs
- Streamline Management of “C” Items
“C” items are low-value, slow-moving goods that often contribute little to overall revenue. With ABC analysis, you can reduce cycle counts, simplify ordering protocols, and opt for “just-in-time” replenishment to cut storage, handling, and obsolescence expenses. - Best Practice: Consolidate “C” item orders into periodic bulk purchases rather than maintaining high safety stocks.
3. Balance Availability and Cost for “B” Items
- Intermediate Priority, Optimized Control
Falling between “A” and “C”, “B” items usually represent 15–25% of SKUs and around 10–20% of inventory value. Moderate monitoring frequency—such as weekly reviews—strikes the right balance, ensuring service levels remain healthy without overinvesting in excess stock. - Strategy Tip: Use demand-driven reorder points and supplier lead-time agreements to align stock levels with predictable consumption.
4. Improve Data-Driven Decision-Making
- Structured, Objective Framework
ABC analysis transforms gut-driven stocking decisions into a transparent, metrics-based process. By assigning clear thresholds (e.g., cumulative 70% value = “A”, next 20% = “B”, remaining 10% = “C”), stakeholders gain shared criteria for prioritizing initiatives like cycle counting, supplier negotiations, and promotional planning. - Outcome: Faster approvals for additional budget on “A” items and justified budget cuts on “C” items through quantifiable data.
5. Enhance Inventory Control and Service Levels
- Tailored Reorder Policies
Setting differentiated reorder points, safety stock levels, and review frequencies for each category prevents both stockouts of high-impact items and overstock of low-value goods. - Risk Mitigation: Automated alerts for “A” items when stock dips below critical thresholds, coupled with periodic reviews for “B” and “C” tiers, ensures you maintain optimal availability without bloating working capital.
In Summary
ABC analysis empowers inventory managers to:
- Concentrate efforts on the top-value items that drive profitability.
- Cut waste and reduce carrying costs on marginal SKUs.
- Strike the right equilibrium between service level and cost for mid-tier products.
- Leverage clear, data-based rules to guide replenishment and review cycles.
- Implement differentiated control mechanisms that safeguard against stockouts and overstock alike.
By embedding ABC analysis into your inventory processes, you’ll allocate resources with precision, sharpen decision-making, and ultimately elevate both your bottom line and customer satisfaction.
Understanding the ABC Classification:
Class A items typically have high demand, high unit value, and low inventory turnover. Class B items have moderate demand, moderate unit value, and moderate inventory turnover. Class C items have low demand, low unit value, and high inventory turnover.
1. “A” items:
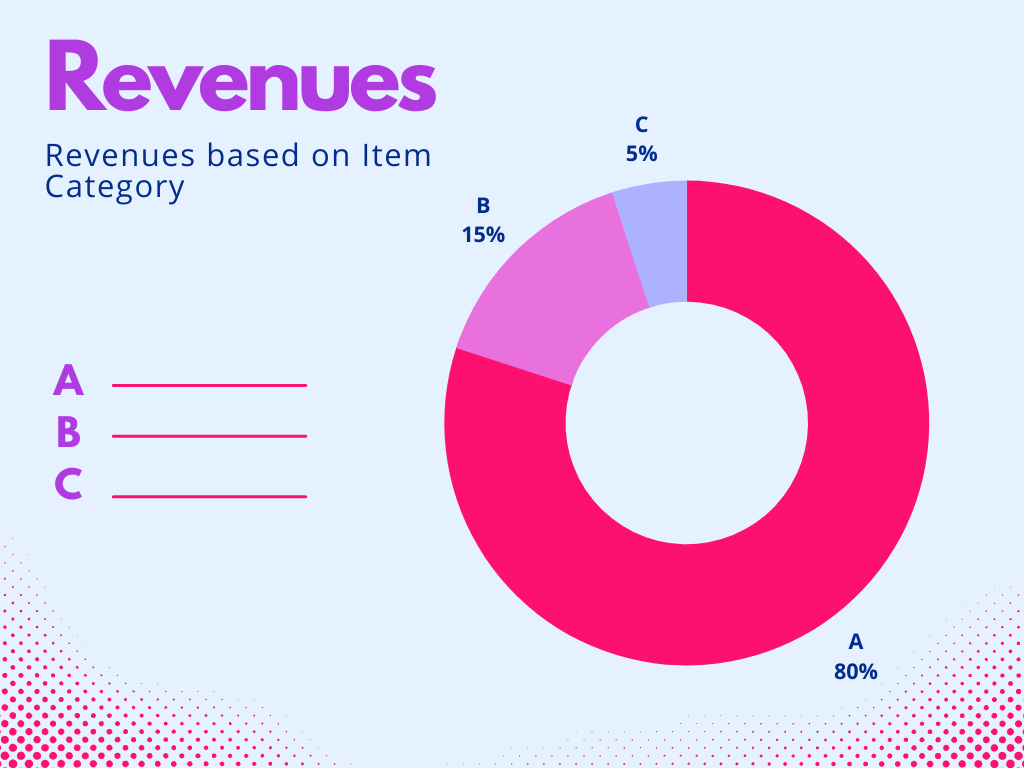
Category A items refer to the most important items in inventory management, typically representing the top 20% of inventory items that account for 80% of the total inventory value or sales. These items are considered the most critical to the success of a business and require the most frequent and detailed attention.
In ABC analysis, “A” items are given the highest priority for inventory management efforts, which typically includes frequent monitoring, careful planning, and strict control of inventory levels. This may involve implementing reorder points, setting up automated reordering systems, or even dedicating specific personnel to manage these items.
The goal of prioritizing “A” items is to ensure that they are always in stock and readily available to meet customer demand. This helps to minimize the risk of stockouts and lost sales, while also maximizing the return on investment in inventory management efforts.
2. “B” items:
Category B items refer to items of medium importance in inventory management, typically representing the next 30% of inventory items that account for around 15% of the total inventory value or sales. These items are considered less critical to the success of a business compared to “A” items but still require some attention and management.
In ABC analysis, “B” items are given a lower priority compared to “A” items, but still require some level of monitoring and control. This may involve implementing reorder points and minimum stock levels, and conducting regular reviews of inventory levels to ensure that they are adequate.
The goal of managing “B” items is to ensure that they are available when needed but without incurring excessive inventory costs. This helps to balance the need for inventory availability with the need to minimize inventory costs.
3. “C” items:
Category C items refer to the least important items in inventory management, typically representing the remaining 50% of inventory items that account for only 5% of the total inventory value or sales. These items are considered the least critical to the success of a business and require the least attention and management.
In ABC analysis, “C” items are given the lowest priority for inventory management efforts, which typically involves minimal monitoring and control. This may involve setting up a basic reordering system or simply monitoring inventory levels periodically.
The goal of managing “C” items is to minimize the amount of resources and effort dedicated to these items, while still ensuring that they are available when needed. This helps to minimize inventory costs while ensuring that inventory is still available when needed.
Benefits of ABC Analysis:
Implementing ABC analysis transforms inventory management from a one-size-fits-all approach into a precision-targeted strategy. By segmenting stock into high-, medium-, and low-value categories, organizations can unlock a range of advantages:
1. Prioritized Focus on High-Impact Stock
Rather than spreading attention equally across thousands of SKUs, ABC analysis highlights the “A” items—typically 10–20% of SKUs that drive 70–80% of inventory value. Prioritizing these critical parts:
- Ensures you never run out of top sellers or mission-critical components
- Allows for tighter safety stocks and more frequent review cycles
- Directs purchasing power where it yields the greatest ROI
2. Smarter Allocation of Resources
Not all items warrant the same level of oversight. With ABC analysis:
- “A” Items receive rigorous demand forecasting, multiple supplier agreements, and automated replenishment triggers
- “B” Items are managed with moderate review intervals and vendor-managed replenishment options
- “C” Items are ordered in bulk or on an “as-needed” basis, cutting down on handling and storage costs
This tiered approach frees up staff time and capital to focus on high-priority tasks.
3. Dramatic Reduction in Stockouts
By shining a spotlight on your most valuable SKUs, ABC analysis drives down the risk of critical stockouts:
- Continuous monitoring of “A” items through real-time dashboards and alerts
- Predictive reordering based on historical consumption patterns
- Safety-stock buffers calibrated to service-level targets
The result? Fewer lost sales, less production downtime, and higher end-customer satisfaction.
4. Leaner, More Cost-Effective Inventory
Carrying costs (storage, insurance, obsolescence) can eat up 20–30% of inventory value annually. ABC analysis combats this by:
- Minimizing overstock of “C” items through consolidated orders or drop-ship models
- Optimizing turnover for “B” items with demand-driven reorder points
- Tightening control on “A” items to avoid excess safety stock
Cutting just 5% off your carrying cost can translate into significant savings on your P&L.
5. Enhanced Forecasting and Decision-Making
ABC classification delivers clarity: data-backed insights replace guesswork. With clear thresholds (e.g., top 70% value = “A”), you can:
- Tailor forecasting models to each class, improving accuracy
- Justify budget allocations for inventory investments with hard numbers
- Drive continuous improvement by tracking category-specific KPIs (turnover, stockout rate)
6. Superior Customer Service Levels
When your highest-value SKUs are always in stock, order fulfillment becomes more reliable. This leads to:
- Shorter lead times for your most in-demand products
- Faster response to rush orders or production changes
- Higher fill rates, boosting customer loyalty and repeat business
7. Streamlined Reporting and Audit Cycles
ABC analysis simplifies cycle counting and audits:
- “A” items can be counted monthly or even weekly
- “B” items quarterly
- “C” items bi-annually or annually
By aligning counting frequency with item importance, audit time shrinks and accuracy improves—without overwhelming your team.
In summary, ABC analysis is not just an academic exercise—it’s a practical framework that helps you:
- Focus on the SKUs that matter most
- Allocate people, money, and systems where they’ll move the needle
- Safeguard against costly stockouts on high-value items
- Trim unnecessary carrying costs on low-value items
- Inform smarter, data-driven decisions
Adopting ABC analysis lays the foundation for a leaner, more agile inventory operation—and ultimately, a more profitable business.
ABC Analysis Statistics: Insights from a Pharmaceutical Case Study
A recent cross-sectional study of 393 pharmaceutical SKUs at the Ethiopian Pharmaceuticals Supply Agency (EPSA) Jimma hub provides concrete metrics on how ABC classification segments inventory and drives management focus:
1. Study Design & Data Quality
- Scope & Period:
- 393 pharmaceutical SKUs distributed during the 2019/20 fiscal year (August 2019–June 2020) were included, representing an 11-month transaction window preceding the annual stock verification in July 2020 PMC.
- Data Sources: Issue transactions and unit-price records were drawn from the electronic Health Commodity Management Information System (HCMIS) and bin-cards, while criticality (VED) ratings came from stakeholder consultations documented in the agency’s procurement list PMC.
- Analytical Tools:
- Microsoft Excel 2013 was used for all calculations—sorting, cumulative percentiles, and cross-tabulations. This choice ensures transparency but introduces risk of manual errors and limits auditability compared to database-driven approaches PMC.
- Fact Check:
- The reliance on a retrospective, single-hub dataset—and exclusion of medical-equipment transactions—means the findings may not generalize across Ethiopia’s 19 EPSA distribution centers or to non-RDF commodities PMC.
2. ABC Classification Outcomes
- Methodology:
- Items were ranked by annual consumption value (quantity × unit price) in descending order.
- Pareto cut-offs (≈70/20/10) defined the A, B, and C classes, though exact SKU counts per class aren’t separately tabulated in the paper.
- Derived Metrics:
- While the authors focus on the combined ABC–VED matrix (“Category I” through “III”), we can infer from their subgroup breakdown:
- AV subcategory (A-class and Vital): 36 items (9% of SKUs)
- AE subcategory (A-class and Essential): 23 items (6%)
- AD subcategory: 0 items (0%)
- Together, AV + AE + AD constitute 59 A-class items (~15% of SKUs), which is in line with standard ABC expectations (10–20% of SKUs) PMC.
- While the authors focus on the combined ABC–VED matrix (“Category I” through “III”), we can infer from their subgroup breakdown:
- Fact Check:
- The study does not provide the pure ABC split (e.g., total A, B, C counts and % of value) in isolation, focusing instead on ABC–VED intersections. This omission limits direct comparison to other ABC-only studies.
3. Integration with VED & FNS Analyses
- VED Layer:
- Items were tagged as Vital (V), Essential (E), or Desirable (D) based on service-criticality and stock-out impact.
- No “Desirable” items appeared in the A-class, reflecting that truly mission-critical SKUs tend also to be high-value PMC.
- FNS Layer:
- Fast/Normal/Slow movement was determined by issue counts and average monthly consumption percentiles (15th, 30th, 45th).
- This allowed the authors to identify slow-moving yet high-value items that might tie up capital unnecessarily.
4. Operational Insights & Limitations
- Key Recommendation:
- Category I (A/V combinations) – 187 SKUs (47.6% of total) account for 90% of annual sales value and warrant the tightest control, frequent cycle counts, and pick-face prioritization PMC.
- Limitations & Caveats:
- Manual Excel Processing: Error-prone and difficult to automate for monthly updates.
- Single-Site Study: Results may differ at other EPSA hubs with different consumption patterns.
- Lack of Pure ABC Metrics: Without a standalone ABC breakdown, benchmarking against global Pareto norms is indirect.
- Static Cost Data: Unit prices can fluctuate; the study assumes constant pricing over 11 months.
5. Reference Linking
- Article:
- Gizaw T, Jemal A. How is Information from ABC–VED–FNS Matrix Analysis Used to Improve Operational Efficiency of Pharmaceuticals Inventory Management? Integr Pharm Res Pract. 2021;10:65–73. DOI: 10.2147/IPRP.S310716 PMC
- PMC Link:
This case study robustly illustrates how layering ABC classification with VED and FNS analyses can pinpoint the ~15% of SKUs that dominate value and criticality. However, the absence of a pure ABC breakdown and reliance on manual Excel workflows suggest opportunities for tighter automation and broader benchmarking in future research.
How to Implement ABC Analysis of Inventory Management:
Implementing ABC analysis requires careful planning, accurate data, and ongoing discipline. Follow these steps to roll out a robust ABC inventory management system tailored to your organization’s needs:
1. Gather and Prepare Your Data
- Compile Transaction History: Pull at least one year of inventory usage data, including quantities issued, production consumption, or sales transactions.
- Capture Cost Information: Record the unit cost or landed cost (including freight, duties, and handling) for each SKU to calculate annual consumption value.
- Include Lead Times & Criticality: Note supplier lead times, order minimums, and any operational criticality factors (e.g., parts that halt production).
- Cleanse & Validate: Remove obsolete SKUs, correct data entry errors, and reconcile any mismatches between your ERP and physical counts.
Tip: A clean dataset is the foundation of a successful ABC analysis—invest the time up front to verify accuracy.
2. Calculate Annual Consumption Value
- Annual Usage × Unit Cost = Consumption Value
- Sort SKUs in descending order by consumption value.
- Compute Cumulative Percentages of both SKU count and total consumption value.
This quantitative ranking reveals which items contribute most to your inventory investment.
3. Define Your Class Thresholds
While a “70/20/10” split (A = top 70%, B = next 20%, C = bottom 10% of value) is common, adjust bands to suit:
- “A” Items: 60–80% of total value
- “B” Items: 15–25% of total value
- “C” Items: 5–15% of total value
Note: Fine-tune thresholds based on business risk, storage constraints, and transaction volumes.
4. Classify Items & Document Results
- Assign Categories: Tag each SKU with its ABC class in your ERP or inventory management system.
- Generate Reports: Produce a segmented SKU list, showing consumption value, quantity on hand, and average lead time for each class.
- Communicate Changes: Educate purchasing, warehouse, and finance teams on the new classifications and associated policies.
5. Configure Control Policies per Class
| Class | Review Frequency | Reorder Point Policy | Safety Stock Level | Cycle Counting |
|---|---|---|---|---|
| A | Weekly or Daily | Demand-driven; multiple suppliers | 1.5–2× lead-time usage | Monthly |
| B | Bi-weekly or Monthly | Fixed reorder point | 1× lead-time usage | Quarterly |
| C | Quarterly or On-demand | Bulk or periodic replenishment | Minimal or zero | Semi-annual/Annual |
Customize these parameters to balance service levels against carrying costs.
6. Automate and Integrate
- ERP Configuration: Set up ABC flags and automated reorder triggers by class.
- Dashboards & Alerts: Build real-time dashboards for “A” items, with low-stock alerts routed to inventory planners.
- Vendor Collaboration: Implement vendor-managed inventory (VMI) for high-volume “B” and “C” items where appropriate.
7. Establish a Review Cadence
- Schedule Re-classification: Re-run the ABC analysis every 6–12 months (or more frequently in fast-moving industries).
- Monitor KPI Trends: Track fill rates, inventory turns, and carrying costs by class to spot drift or anomalies.
- Continuous Improvement: Adjust thresholds, safety stocks, and review frequencies based on actual performance data.
8. Address Limitations & Edge Cases
- Multi-Criteria Scoring: For critical or high-volatility items, consider a weighted score combining value, lead-time risk, and demand variability.
- Obsolescence Management: Flag slow-moving “C” items for markdown, consignment, or disposal processes.
- Cross-Functional Alignment: Involve sourcing, production, and sales teams to ensure classification criteria reflect operational realities.
By following this structured approach, you’ll embed ABC analysis into daily operations—transforming raw data into actionable insights, optimizing working capital, and elevating service levels across your supply chain.
Implementing ABC Inventory Management Using Software:
Leveraging specialized inventory-management software transforms ABC analysis from a manual spreadsheet chore into an automated, scalable process. By embedding classification logic directly into your systems, you ensure real-time insights, consistent policies, and tighter control across your entire stock portfolio. Follow these three core steps to successfully deploy ABC analysis via software:
1. Select the Right Software
- Assess Core Functionality:
- Data Ingestion: Can the platform import historical usage, costs, and lead times from your ERP or WMS automatically?
- ABC Module: Does it offer a dedicated ABC classification report or wizard that lets you define thresholds (e.g., top 70% = A)?
- Customization & Alerts: Look for schedulable reports, threshold-based email alerts, and user-defined dashboard widgets.
- Integration Capabilities:
- Ensure seamless two-way connectivity with your ERP, purchasing, and finance systems to avoid manual exports.
- Verify API support or native connectors for third-party tools (shipping, e-commerce platforms, forecasting applications).
- Ease of Use & Support:
- Choose a solution with an intuitive interface and strong vendor support—consider trial periods and reference calls with similar‐sized companies.
- Evaluate training resources (online tutorials, dedicated onboarding teams) to accelerate adoption.
2. Centralize and Validate Your Data
- Automated Data Feeds:
- Schedule regular imports (daily or weekly) of transaction history, including goods receipts, issues, returns, and adjustments.
- Pull live cost updates—unit price, landed cost, and surcharge factors—to ensure consumption values stay current.
- Data Quality Controls:
- Configure validation rules that flag missing or zero‐cost SKUs, negative usage entries, and outlier transactions.
- Employ built-in deduplication tools to merge duplicate SKUs and normalize unit‐of‐measure discrepancies.
- Master Data Cleanup:
- Use bulk-edit features to correct unit costs, standardize descriptions, and tag criticality levels before running your first ABC job.
- Archive or deactivate obsolete items to prevent noise in your classification outputs.
3. Automate Classification and Embed into Workflows
- Define Your ABC Parameters:
- Within the software, set your desired value-based thresholds (for example, A = 70% of total consumption value, B = next 20%, C = remaining 10%).
- If available, enable additional scoring dimensions—lead-time risk, demand variability, or component criticality—to refine the segmentation.
- Schedule Re-Classification Jobs:
- Automate periodic runs (monthly, quarterly, or custom cadence) so that SKUs automatically move between classes as usage and costs evolve.
- Archive historical snapshots to track how items shift over time, supporting audit and continuous-improvement initiatives.
- Embed Into Operational Policies:
- Tie ABC classes directly to reorder-point rules, safety-stock formulas, and cycle-count frequencies in the system’s replenishment settings.
- Configure low-stock notifications by class—e.g., red alerts for “A” items, yellow for “B,” and green for “C”—so planners can triage actions at a glance.
- Expose class-specific KPIs on executive and planner dashboards, driving accountability and transparency in your inventory governance.
By carefully selecting a platform, ensuring data integrity, and automating the classification workflow, you’ll unlock the full power of ABC analysis—delivering sharper insights, faster decision-making, and a truly agile inventory operation.
Limitations of ABC Analysis:
While ABC analysis offers clear advantages for segmenting inventory by value, it also carries inherent limitations. Understanding these caveats will help you apply the method more judiciously and augment it with complementary tools.
1. Reliance on Data Availability and Quality
- Data Gaps Undermine Accuracy:
ABC classification hinges on reliable cost and usage figures. Incomplete purchase records, unlogged production consumption, or mis-priced units can skew consumption-value calculations—potentially misclassifying a high-value item as “B” or “C.” - Dynamic Cost Challenges:
Unit costs aren’t static. Freight surcharges, volume discounts, currency fluctuations, and supplier price changes can alter an item’s true value week to week. Without frequent cost updates, your classification quickly grows stale. - Mitigation:
- Implement strong data-governance practices, ensuring inventory transactions are recorded accurately and promptly.
- Schedule quarterly or even monthly cost reviews—especially for “A” items—to capture price shifts.
- Where precise usage data is lacking, consider sampling or cycle-count spot checks to validate assumptions.
2. Ignoring Inter-Item Relationships and Dependencies
- Sibling and Kit Components:
Many SKUs are used together—think electronic assemblies or meal-kit ingredients. ABC analysis treats each item in isolation, failing to recognize that a “C”-value component may be critical because it’s required alongside a high-value “A” part. - Substitution Effects and Cannibalization:
Changes in the availability or pricing of one SKU can drive customers toward substitutes, altering demand patterns. A standalone ABC view won’t reveal these dynamic interactions. - Mitigation:
- Layer in bill-of-materials (BOM) analysis to flag low-value items that feed into high-value assemblies.
- Use correlation analysis on historical sales data to uncover substitution or cannibalization trends.
- Incorporate a multi-criteria scoring model (e.g., weighted value + criticality) so that dependency-driven items receive appropriate attention.
3. Limited Applicability in Volatile or Seasonal Markets
- Seasonal Demand Spikes:
In industries like fashion or holiday goods, an item that ranks low in annual usage can suddenly surge in importance during peak season. ABC’s annualized lens dilutes these periodic highs. - Rapidly Changing Product Lines:
Technology firms or trend-driven retailers launch, pivot, and discontinue SKUs at a fast clip. By the time an ABC run finishes, the product portfolio may have shifted significantly. - Mitigation:
- Adjust the analysis cadence to match your market rhythm—run monthly for highly seasonal lines, or even weekly during peak periods.
- Complement ABC with XYZ analysis (demand variability classification), identifying “X” items (steady demand) versus “Z” items (highly erratic) to catch volatility.
- Adopt rolling-horizon reviews that incorporate both recent short-term trends and full-year figures.
Key Takeaway
ABC analysis is a powerful first step in prioritizing inventory, but it shouldn’t be treated as a standalone solution. By acknowledging its data dependencies, blind spots around item interrelationships, and potential misalignment with seasonal or volatile markets—and by layering in complementary analyses—you’ll build a more robust, responsive inventory-management framework that truly aligns resources with risk and value.
Overcoming Challenges in Implementing ABC Analysis
Even the most robust inventory methodologies can run into roadblocks during execution. Below are three of the most common hurdles organizations face when rolling out ABC analysis—and practical strategies for navigating them successfully.
1. Resistance to Change
Why It Happens:
- Teams may see ABC analysis as “extra work” on top of existing routines.
- Planners and warehouse staff worry that new classifications will disrupt familiar reorder and counting processes.
How to Overcome:
- Communicate Benefits Early: Host a kick-off workshop highlighting success stories—e.g., how peers cut carrying costs by 15% in the first year.
- Engage Champions: Recruit influential power users in purchasing, operations, and finance as “ABC ambassadors” to provide peer-to-peer coaching.
- Provide Hands-On Training: Use real SKUs in interactive training sessions so employees experience how ABC tags simplify their daily tasks (e.g., automated low-stock flags for “A” items).
2. Difficulty in Determining Item Value
Why It Happens:
- Large SKU counts make manual valuation tedious.
- Fluctuating costs (supplier price changes, freight surcharges) lead to outdated unit-cost data.
How to Overcome:
- Automate Calculations: Leverage your ERP or inventory system’s built-in ABC module to pull live usage and cost data rather than relying on spreadsheets.
- Adopt a Tiered Rollout: Start with your top 20–30 “A” SKUs to validate the process, then progressively include “B” and “C” items.
- Regular Cost Audits: Schedule quarterly or monthly reviews of unit-cost inputs—especially for high-value items prone to price swings.
3. Inaccurate or Incomplete Data
Why It Happens:
- Unrecorded returns, manual stock adjustments, and mis-scanned barcodes distort true usage figures.
- Disparate systems (ERP vs. WMS vs. Excel) create data silos.
How to Overcome:
- Strengthen Data Governance: Define clear ownership for data entry, approvals, and exceptions. Document workflows for transaction posting and cycle counts.
- Increase Counting Frequency: Tie your ABC classes to count cadences—e.g., monthly counts for “A,” quarterly for “B,” bi-annual for “C.” This not only validates quantities but also reinforces data accuracy in the system.
- Integrate Systems: Where possible, link your warehouse management system directly to your ERP so that scans, adjustments, and returns flow automatically into consumption reports.
4. Limited Resources and Competing Priorities
Why It Happens:
- Smaller teams may lack dedicated analysts or budget for specialized ABC software.
- Everyone is already “busy”—ABC implementation can slip down the to-do list.
How to Overcome:
- Pilot First: Demonstrate quick wins by running ABC on a single product line or top-seller category. Use the results to secure additional buy-in and budget.
- Leverage Existing Tools: Explore free or low-cost ERP modules, BI dashboards, or even spreadsheet templates that automate much of the ABC logic before investing in new software.
- Allocate Roles Clearly: Assign specific tasks—data cleanup, report review, classification updates—to individuals or small teams and build the effort into annual objectives and KPIs.
By proactively addressing these challenges with clear communication, automation, and phased rollouts, you’ll accelerate user adoption, ensure data integrity, and unlock the full efficiency gains of ABC analysis across your inventory operations.
Conclusion:
ABC analysis serves as a cornerstone of modern inventory management, transforming sprawling SKU portfolios into a clear, value-driven hierarchy. By systematically categorizing items into A, B, and C classes, organizations can:
- Concentrate Resources: Direct attention, capital, and systems toward the handful of “A” items that represent the bulk of inventory investment.
- Streamline Operations: Tailor review cycles, safety-stock rules, and replenishment policies to each class—cutting waste on low-value items while safeguarding high-impact stock.
- Drive Data-Backed Decisions: Replace gut instincts with quantifiable metrics, improving forecasting accuracy, reporting clarity, and cross-functional alignment.
- Boost Service & Profitability: Reduce stockouts on mission-critical parts, lower carrying costs on marginal items, and free up working capital for strategic growth initiatives.
While ABC analysis really shines when embedded into ERP or inventory-management software, its true value lies in the discipline it instills: a commitment to ongoing data validation, regular re-classification, and continuous process refinement.
By adopting ABC analysis as an integral part of your inventory ecosystem—backed by clean data, cross-team collaboration, and automated workflows—you’ll build a leaner, more responsive supply chain that delivers both superior customer service and strong financial returns.
Related Post:
Safety Stock – Definition, Importance, Formulas & Implementation
There are a few different formulas that go into deciding how much safety stock you have to maintain. These include General formula,…
Click here to Read This ArticleFound this helpful? Share it:
ABC analysis is an inventory management technique that categorizes items into three groups (A, B, and C) based on their value and importance…
ABC analysis is an inventory management technique that categorizes items into three groups (A, B, and C) based on their value and importance…
ABC analysis is an inventory management technique that categorizes items into three groups (A, B, and C) based on their value and importance…