A reorder point (ROP) is the minimum inventory level that triggers a replenishment order for a specific item. In essence, it’s a signal that says, “It’s time to restock!“
Reorder Point helps maintain optimal inventory levels. It is crucial as it avoids stockouts, optimizes inventory levels to reduce costs and spoilage, and improves cash flow by preventing excessive stock.
The reorder point is calculated by taking into account average daily sales, lead times, and safety stock.
The basic formula for calculating a reorder point is:
Reorder Point (ROP) Formula
Definitions
- Safety Stock: Buffer inventory kept to cover demand spikes or delays.
- Average Daily Sales: Typical number of units sold per day (e.g., average over the last 30–90 days).
- Lead Time (days): Days from placing an order to receiving usable stock.
Tip: For a more conservative ROP, some teams use maximum daily demand instead of average, or add variability buffers to lead time.
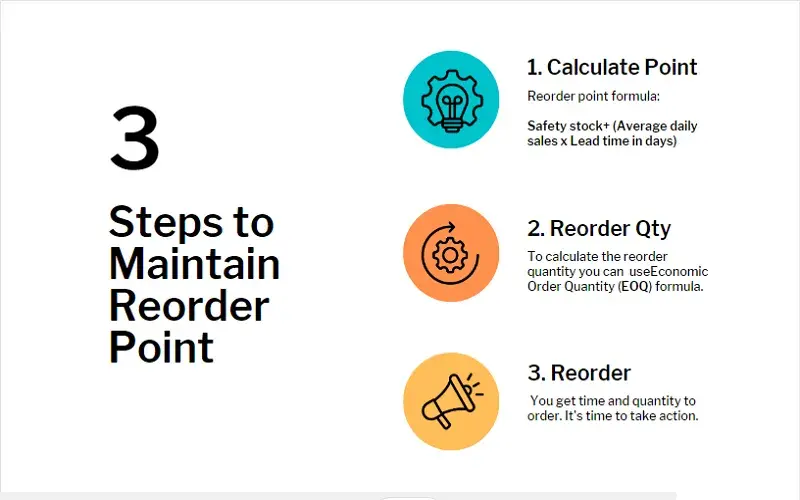
Importance of Reorder Point:
Inventory is a crucial part of any business and the reorder point is an important part of managing that inventory. The reorder point is the point at which a business needs to reorder inventory to keep up with customer demand.
The reorder point is important because it helps businesses in keep your inventory in a balanced levels which to minimize costs, maximize profits, and business capability. Reorder point help to prevent stockouts. Stockouts can lead to lost sales, unhappy customers, and a hit to the business’s reputation.
1. Avoid stockouts:
Reorder point is the level of inventory that triggers a replenishment order. In other words, it’s the point at which you need to reorder more inventory to keep up with demand which helps to avoid stockouts and keep your business running smoothly.
To avoid stock outs, businesses need to monitor their inventory levels closely and place orders for new inventory as soon as they reach the reorder point.
2. Optimize inventory level:
Understanding and using reorder point is essential to maintain optimized inventory levels. The quantity of inventory at which you must reorder is known as your reorder point. You may prevent stockouts and maintain the smooth operation of your company by being aware of and leveraging your reorder point.
On the hand, too much stock can tie up capital, while too little can lead to disruptions in the supply chain.
The goal is to find the perfect balance of inventory levels so that you have enough stock to meet customer demand without tying up too much capital in inventory.
3. Improves inventory turnover:
The reorder point can assist firms in increasing their inventory turnover, which is a measurement of how rapidly inventory is sold and replaced, by preventing stockouts and overstocking. This may result in more profits, lower carrying costs, and better supply chain performance.
4. Improves cash flow:
Businesses can manage their cash flow better by preventing stockouts and overstocking by balancing inventory levels using reorder points.
5. Cost savings:
Reorder point is the inventory level at which a company orders more goods. The optimal inventory level is the balanced level between demand and supply that minimizes the total cost of inventory including purchase, warehouse space rents, carrying, operational costs.
Factors that Affect Reorder Point:
There are a few factors to consider when determining your reorder point.
First, you’ll need to know your average daily sales. This will help you determine how much inventory you need on hand to meet customer demand.
Next, you’ll need to take into account your lead time. Lead time is the amount of time it takes to receive new inventory from your supplier.
Finally, you’ll need to factor in safety stock. Safety stock is a buffer of inventory that you keep on hand in case of unexpected spikes in demand or delays in receiving new inventory.
Safety stock:
Safety stock is a term used in inventory management that refers to a level of extra stock that is maintained to mitigate the risk of stockouts. Stockouts can lead to lost sales, unhappy customers, and production delays, so it is important to have a safety stock buffer to protect against them.
There are a few different methods for calculating safety stock, but the most common is :
Safety Stock Formula
Definitions
- Maximum Daily Sales: The highest number of units sold in a single day during the period measured.
- Maximum Lead Time: The longest time (in days) taken for stock to arrive after an order.
- Average Daily Sales: Typical number of units sold per day over a given period.
- Average Lead Time: Usual time (in days) taken for stock to arrive.
This method helps account for demand and lead time variability, reducing the risk of stockouts during peak demand or supply delays.
Example: Calculating Safety Stock
Given:
- Maximum daily sales = 10 Pcs
- Average daily sales = 6 Pcs
- Maximum lead time = 5 Days
- Average lead time = 3 Days
Calculation:
Demands/sales rate:
Sales rate is one of the key factors in calculating your reorder point. By understanding your sales rate, you can more accurately forecast future demand and ensure you have the inventory on hand to meet customer needs.
Lead time:
Lead time is the time it takes to receive an order and is a key input in calculating the reorder point. The reorder point is the point at which a company needs to replenish its inventory.
Lead time can also be affected by seasonal factors. For example, lead time might be longer in the summer due to vacations, or shorter in the winter due to holiday orders.
The reorder point is calculated by adding the lead time to the desired safety stock. Safety stock is the extra inventory that a company keeps on hand to avoid stock outs.
Factors that Affect Reorder Point
Knowing when to reorder is key to avoiding stockouts and overstocking. These three core factors determine your optimal reorder point.
Average Daily Sales
Average daily sales indicate how much stock you need to meet daily demand. Tracking this helps maintain just enough inventory without excess.
- Calculate based on recent sales data
- Account for seasonal fluctuations
- Forms the base for reorder calculations
Lead Time
The time it takes for new inventory to arrive after placing an order. Longer lead times mean you’ll need to reorder earlier.
- Consider supplier reliability
- Account for seasonal delays
- Directly impacts reorder timing
Safety Stock
Extra inventory kept to protect against demand spikes or supply delays. Calculated using:
Safety Stock = (Max Daily Sales × Max Lead Time) − (Avg Daily Sales × Avg Lead Time)
- Prevents stockouts during demand surges
- Example: (10×5) − (6×3) = 32 Pcs
- Acts as an emergency buffer
Reorder Point Formula:
The reorder point formula is a tool that inventory managers use to determine when to reorder stock.
Reorder Point (ROP) Formula
Definitions
- Safety Stock: Buffer inventory kept to cover demand spikes or delays.
- Average Daily Sales: Typical number of units sold per day (e.g., average over the last 30–90 days).
- Lead Time (days): Days from placing an order to receiving usable stock.
Tip: For a more conservative ROP, some teams use maximum daily demand instead of average, or add variability buffers to lead time.
Maintaining reorder point ensures that there is perfect amount of inventory on hand to meet customer demand, while also avoiding the costly consequences of stock outs. By keeping a close eye on inventory levels and using the reorder point formula to guide reordering decisions, inventory managers can strike the perfect balance between too much and too little stock.
Fixed reorder point:
In a fixed reorder point, you can set a specific threshold for each item in your inventory and automatically generate a purchase order when that threshold is reached. This can take the guesswork out of reordering and help you keep your shelves stocked with the products your customers need.
Variable reorder point:
Variable reorder point is a technique for calculating the ideal time to reorder a product by taking into consideration both the lead time for a product (the amount of time it takes for a product to be delivered after an order is placed) and the product’s consumption/sales rate.
Reorder point calculator:
The reorder point calculator is a tool that helps you determine the perfect time to reorder inventory. By taking into account factors like lead time and safety stock, the calculator provides you with a customized reorder point that ensures you have the right amount of inventory on hand, at all times.
This calculator using the formula:
Reorder Point=Safety stock+Average daily sales* Lead time.
Safety stock: The reserve inventory that is kept on hand to account for unforeseen circumstances (e.g. an unexpected increase in demand).
Average daily sales: The average amount of sales made per day over a specific period of time.
Lead time: The time it takes to receive a new shipment of inventory after an order is placed.
Putting these three factors together will give a reorder point for an item using the reorder point formula. For example, let’s say safety stock for an item is 50 and your average daily sales are 10 units and your lead time is 5 days. This means you need to replenish your inventory when you reach 100 units.
Real-world Examples:
Some real-world examples of how to calculate reorder point:
- Example 1: A small business sells t-shirts online. The business has a lead time of 10 days and an average daily demand of 10 shirts. The business wants to have a safety stock of 50 shirts. To calculate the reorder point, the business would use the following formula:
Reorder Point = Lead Time Demand + Safety Stock
In this example, the reorder point would be 150 shirts. This means that the business should reorder t-shirts when the inventory level reaches 150 shirts.
- Example 2: A large retailer sells groceries. The retailer has a lead time of 5 days and an average daily demand of 1,000 items. The retailer wants to have a safety stock of 500 items. To calculate the reorder point, the retailer would use the following formula:
Reorder Point = Lead Time Demand + Safety StockIn this example, the reorder point would be 1,500 items. This means that the retailer should reorder groceries when the inventory level reaches 1,500 items.
These are just two examples of how to calculate reorder point. The specific formula that you use will depend on the specific factors of your business. However, by understanding the basic concepts, you can use the formula to calculate the reorder point for any product or service.
Reorder Quantity:
Reorder quantity is the amount you have to order.
There are many different ways to calculate the reorder quantity for inventory, and the goal is to have enough inventory on hand to meet customer demand without incurring excessive carrying costs.
One common method for calculating the reorder quantity is to use the Economic Order Quantity (EOQ) formula. This formula takes into account the fixed costs of ordering and the variable costs of carrying inventory.
Another method is to use the Average Inventory Method. This method simply calculates the average amount of inventory that is used over a period of time and orders that quantity when inventory levels reach a certain point.
Ultimately, the best way to calculate the reorder quantity will vary depending on the specific business and inventory situation. The important thing is to select a method that meets the needs of the business and provides the desired level of customer service.
Economic order quantity (EOQ):
Economic order quantity (EOQ) is the amount of inventory that a business should order to minimize the cost of inventory and storage. This quantity is based on the company’s sales volume, production cycle, and the cost of inventory. The EOQ is the point at which the company’s ordering and carrying costs are equal.
A company’s ordering cost includes the cost of placing and receiving an order, as well as the cost of the materials. The carrying cost is the cost of storing the inventory, which includes the cost of the space and the cost of the materials.
The EOQ model is a simple way to determine the optimal order quantity for a company. This model takes into account the company’s sales volume, production cycle, and the cost of inventory. The EOQ is the point at which the company’s ordering and carrying costs are equal.
The EOQ model is a simple way to determine the optimal order quantity for a company.
Economic Order Quantity (EOQ) Formula
The EOQ model is a simple way to determine the optimal order quantity for a company.
Where:
- Demand: The number of units required per year.
- Order Cost: The cost of placing an order.
- Holding Cost: The cost of holding one unit in inventory for a year.
Open to buy:
Open to buy (OTB) is a term used in the retail industry to describe the amount of money that a retailer has available to spend on inventory. It is calculated by subtracting the projected cost of goods sold from the current inventory levels.
Open to buy can be a useful formula for retailers to track their spending and ensure that they are not overspending on inventory. It can also help them to plan for future inventory needs.
OTB = planned sales + planned markdowns + planned end of month inventory – beginning of month inventory.
Fixed-Period vs Fixed-Quantity Inventory System:
There are two main types of inventory systems: fixed-quantity and fixed-period. In a fixed-quantity system, a company orders a set amount of inventory each time it runs low. This system is also known as the reorder point system. In a fixed-period system, a company orders inventory at set intervals, regardless of how much inventory is on hand.
The main advantage of a fixed-period system is that it can help a company save money on inventory costs. If a company knows it only needs to order inventory once per month, it can order larger quantities each time, which can lead to discounts from suppliers.
The main advantage of a fixed-quantity system is that it can help a company avoid stock-outs. If a company knows it will need 200 widgets every week, it can order 200 widgets each time it runs low, rather than waiting until it has zero widgets in stock. This can help keep customers happy and avoid lost sales.
Advanced Reorder Points: Beyond the Basics 📈
While the simple reorder point formula—Daily Demand x Lead Time—is a great starting point, the real world is messy. Demand can spike unexpectedly, and suppliers can face delays. This is where a more advanced approach to calculating your reorder point comes in, one that incorporates safety stock to protect your business from these uncertainties.
The key to a truly effective reorder point lies in understanding and quantifying these risks. We can do this by adding a safety stock calculation that considers both the variability of demand and the variability of lead time. This is where we bring in the concept of a service level.
What is a Service Level? 🤝
Think of a service level as your desired level of customer satisfaction. It’s a measure of the probability that you will have enough inventory on hand to meet customer demand during the lead time. For example, a 95% service level means you want to be 95% certain that you won’t have a stockout. The higher the service level, the higher your safety stock will be, which means a higher reorder point.
To achieve this, we use a statistical factor called a Z-score. This number is directly tied to your chosen service level. For a 95% service level, the Z-score is typically around 1.65. For a 99% service level, it’s about 2.33.
The Advanced Reorder Point Formula 📊
This is where the magic happens. The more sophisticated formula for a reorder point looks like this:
Reorder Point = (Average Daily Demand × Average Lead Time) + Safety Stock
The Safety Stock portion is the crucial part that we’re going to dive into. A common formula for safety stock is:
Safety Stock = Z-score × Standard Deviation of Lead Time Demand
To calculate the Standard Deviation of Lead Time Demand, you need to look at your historical data. You would track the number of units sold during each lead time period and then calculate the standard deviation of those numbers. This gives you a measure of how much your demand fluctuates during the time you’re waiting for a new order.
Let’s break it down into simple, actionable steps:
- Determine your Service Level: Decide on the level of protection you need against stockouts (e.g., 95%, 99%). This will give you your Z-score.
- Gather your data: You’ll need your average daily demand, average lead time, and historical sales data to find the standard deviation of demand during lead time.
- Calculate the Reorder Point: Plug all these values into the formulas above.
This advanced approach moves beyond a simple, static number and creates a dynamic reorder point that adjusts to the real-world unpredictability of your business, ensuring you’re stocked up and ready for whatever comes your way.
Best Practices for Success 🏆
Simply knowing the reorder point formula isn’t enough. To truly succeed, you need to embed it into a smart and proactive inventory management strategy. Think of these as the golden rules that will turn a simple formula into a powerful business tool.
🤝 Foster Strong Supplier Relationships
Your reorder point is only as good as the information it’s based on, and a big part of that is lead time. Unreliable suppliers and unpredictable lead times can quickly throw your calculations off and lead to stockouts.
- Keep the lines of communication open: Regularly check in with your key suppliers. Ask about their production schedules, potential delays, and how you can work together to improve delivery times.
- Build redundancy: If possible, don’t rely on a single supplier for your most critical items. Having a backup plan or a secondary supplier can save you from a major disruption.
📊 Embrace Data-Driven Decisions
Your reorder point numbers are living, breathing entities that need fresh data to stay relevant. Relying on old data is like navigating with an outdated map.
- Track everything: Keep detailed records of your daily sales, lead times, and any unexpected demand spikes or stockouts. This data is the fuel for your reorder point calculations.
- Use technology: A good inventory management system (IMS) is invaluable. It can automatically track your sales, calculate your reorder points, and even place orders for you when stock levels get low. This minimizes human error and frees up your time for more strategic work.
🔄 Implement Regular Reviews and Adjustments
A reorder point is not a “set it and forget it” tool. It requires consistent monitoring and adjustments to remain effective.
- Schedule reviews: Set up a routine for reviewing your reorder points. For critical, high-value products (your A-items), this should be a monthly check. For other items, a quarterly or bi-annual review might be sufficient.
- React to change: Be proactive. If you launch a new marketing campaign that you expect to increase demand, or if a supplier notifies you of a longer lead time, immediately update your reorder point. Waiting until the next scheduled review could be too late.
By following these best practices, you’ll ensure your reorder point system is not just a theoretical formula but a dynamic, reliable, and powerful asset that helps you optimize your inventory, reduce costs, and keep your customers happy.
Automating Your Reorder Point Strategy with Technology 🤖
While the reorder point formula is a crucial tool, manually tracking stock levels and calculating reorder points for every item can quickly become overwhelming and prone to error. This is where modern inventory management software (IMS) and automation come in, transforming a manual process into a streamlined, error-free system.
The Power of Automated Reorder Points
Modern IMS platforms automate the entire reorder point process, from data collection to order generation. This means you can spend less time on calculations and more time on strategic business decisions. Here’s how technology revolutionizes the process:
- Real-Time Data Tracking: Instead of manually counting stock, an IMS automatically tracks every sale, return, and restock in real time. This provides the most accurate and up-to-date data for your reorder point calculations.
- Dynamic Calculations: The software uses the advanced formulas we discussed, constantly calculating and updating reorder points for each item based on real-time sales data, lead times, and your desired service levels. This ensures your reorder points are always relevant and not based on old averages.
- Automated Purchase Order Generation: The most significant benefit of automation is the ability to generate purchase orders (POs) automatically. When an item’s stock level drops to its reorder point, the system can instantly create a PO and send it to the appropriate supplier, all without human intervention. This eliminates the risk of human oversight and ensures you never miss an opportunity to restock.
Key Features to Look For in an IMS
When choosing software to manage your reorder points, look for these features:
- Customizable Alerts and Notifications: The system should send you alerts when an item is nearing its reorder point or when a supplier’s lead time has changed. This keeps you informed and allows you to intervene if needed.
- Integration with Other Systems: A great IMS will integrate with your accounting software, e-commerce platform, and point-of-sale (POS) systems. This creates a unified flow of information, from a customer’s purchase to the automatic reordering of that item.
- Forecasting Capabilities: Advanced platforms use historical data and even AI to forecast future demand. This helps you predict seasonal spikes or trends and proactively adjust your reorder points before a problem arises.
By leveraging technology, you can elevate your reorder point strategy from a reactive, manual task to a proactive, automated system that saves you time, reduces stockouts, and boosts your bottom line.
Reorder Point in Practice: Role of an Inventory Management System 💻
In theory, the reorder point is a straightforward calculation. In practice, manually managing it is a near-impossible task. The very foundation of a successful reorder point—accurate sales history and demand data—is constantly in flux. Demand isn’t a fixed number; it’s a dynamic, living metric that’s influenced by seasonal trends, marketing efforts, and market changes.
This is why trying to calculate and maintain reorder points with a manual system, like a spreadsheet, is a recipe for frustration and error. It requires you to constantly pull sales data, manually calculate new demands based on trends you’ve spotted, and then update your safety stock and reorder point for every single product—an unsustainable process for any business with more than a handful of SKUs.
This is where a modern inventory management system (IMS) becomes not just a convenience, but a necessity. A robust IMS is designed to handle this complexity automatically. It programmatically keeps a constant eye on your sales trends, leveraging real-time data to calculate and adjust your reorder points as demand fluctuates.
Here’s how an IMS brings the reorder point to life:
- Intelligent Demand Forecasting: The system analyzes your historical sales data to identify trends, seasonality, and other patterns. It uses this information to project future demand, giving you a more accurate number to base your calculations on than a simple average.
- Automated Safety Stock: As demand and lead times become more volatile, the IMS automatically recalculates the necessary safety stock, ensuring your buffer is always sufficient for your desired service level.
- Proactive Reminders: The days of manually checking stock levels are over. The IMS continuously monitors your inventory and sends you a timely notification when an item’s stock level is approaching its reorder point. This alert tells you exactly what to order and how many, taking the guesswork out of the process.
By using an inventory management system, you’re not just automating a task; you’re transforming your inventory strategy from a reactive, manual burden into a proactive, intelligent system that consistently keeps your business running smoothly.
Reorder Point: When It’s Not a Perfect Solution 🚧
The reorder point is a powerful tool, but it’s not a silver bullet. It works best in stable environments with predictable demand and reliable suppliers. When your business faces real-world complexities, the basic formula can fall short. Here are some key limitations and how to manage them.
📉 Highly Seasonal or Unpredictable Demand
The traditional reorder point formula relies on average daily demand. This breaks down when demand is not an average at all.
- Seasonal Demand: A reorder point set for an average day in July will lead to stockouts during a busy December holiday season and overstocking during a slow February.
- Erratic or Lumpy Demand: Some products have sales that are random and infrequent, like replacement parts for a rarely-used machine. A fixed reorder point can trigger an order for an item that won’t sell for months, tying up your cash.
Best Practice: Instead of a fixed reorder point, consider using a dynamic reorder point. For seasonal items, you can adjust the daily demand component of the formula on a monthly or quarterly basis to reflect expected sales peaks and valleys. For lumpy demand, a manual review process or a Min/Max inventory system is often more effective, where you only reorder when stock drops below a certain minimum and order up to a maximum level.
⏳ Unreliable Lead Times
The formula also assumes a consistent lead time from your supplier. However, lead times can fluctuate due to shipping delays, production issues, or unforeseen events. A longer-than-expected lead time can result in a stockout even if you placed the order on time.
Best Practice: To manage this, a robust safety stock calculation that accounts for lead time variability is essential. Additionally, maintain strong relationships with your suppliers. Communicate openly about potential delays and, if possible, work with multiple suppliers to mitigate risk.
🗓️ When to Review and Adjust
A reorder point is not a “set it and forget it” number. It’s a living part of your inventory strategy that needs regular attention.
- Review Cadence: For your most critical, high-value items (A-items), you should review and adjust your reorder point at least monthly. For less critical items, a quarterly or bi-annual review might suffice.
- Triggering Events: Don’t wait for a scheduled review to make changes. Adjust your reorder point whenever there’s a significant change in demand (e.g., a new marketing campaign), a change in supplier lead time, or a change in your desired service level.
By understanding these limitations and implementing these best practices, you can fine-tune your reorder point strategy to work effectively in a dynamic and unpredictable business environment.
Tailoring Your Strategy: Not All Inventory is Created Equal ⚖️
When it comes to reorder points, a “one-size-fits-all” approach simply doesn’t work. Different items in your inventory have different levels of importance and value to your business. To build a truly strategic and effective reorder point system, you need to classify your inventory and adjust your strategy accordingly. The two most common and effective methods for this are ABC Analysis and XYZ Analysis.
📈 ABC Analysis: Prioritizing Your Products
The ABC method classifies your inventory into three categories based on its value or importance. This is usually measured by a product’s annual usage value (annual demand multiplied by cost per unit).
- A-Items (High Value): These are your most valuable products, typically making up about 20% of your items but accounting for 80% of your total value. Think of your top-selling, high-margin products.
- Strategic Adjustment: A-items require a highly precise reorder point with a high service level (99% or higher) and a tight safety stock. Since running out of these items is catastrophic, you’ll want to review their demand and lead time data frequently to ensure your reorder point is always accurate.
- B-Items (Medium Value): These are the middle-of-the-road items, making up about 30% of your products and 15% of your total value.
- Strategic Adjustment: B-items can use a moderate service level (around 90-95%). You can use the standard reorder point formula but review the data less frequently than for A-items. The goal is a balance between a high service level and not tying up too much capital in safety stock.
- C-Items (Low Value): These are the bulk of your inventory, making up 50% of your items but only 5% of your value. These are your low-cost, slow-moving parts.
- Strategic Adjustment: C-items can often use a lower service level (e.g., 85%). The reorder point for these items can be set and reviewed less often. It’s often more cost-effective to have a larger batch of these on hand to avoid frequent ordering costs, even if it means a higher inventory holding cost.
🔄 XYZ Analysis: Understanding Demand Consistency
While ABC focuses on value, XYZ analysis classifies inventory based on the consistency of its demand. This helps you manage items with predictable versus unpredictable sales.
- X-Items (Stable Demand): These products have a very predictable and consistent demand.
- Strategic Adjustment: For X-items, you can use a precise reorder point with a minimal amount of safety stock. The low variability in demand means you don’t need a large buffer.
- Y-Items (Variable Demand): These items have some seasonality or moderate fluctuations in demand.
- Strategic Adjustment: Y-items require a more advanced reorder point with a higher safety stock to account for the variability. You should actively monitor demand trends and adjust the reorder point as needed to prepare for seasonal spikes.
- Z-Items (Erratic Demand): These are the wild cards—items with very sporadic, unpredictable demand.
- Strategic Adjustment: For Z-items, a traditional reorder point system might be ineffective. Instead, a min/max system or a manual review process might be better suited. The reorder point for these items would be set at a very high level, or you might even decide to stock them only when a customer places an order.
By combining ABC and XYZ analysis, you can create a highly sophisticated and effective inventory management strategy that ensures you’re never overstocked on low-value items or understocked on your most critical products.
Conclusion:
In the fast-paced world of both retail and manufacturing, inventory management can be the difference between success and failure. While the basic reorder point formula is a good starting point, the real power lies in a strategic, data-driven approach that’s tailored to your unique business needs.
By moving beyond a simple average and incorporating advanced methods like ABC/XYZ analysis, dynamic safety stock calculations, and automated technology, you transform your inventory strategy from a reactive task into a proactive asset. Whether you’re a small online retailer managing a few dozen products or a manufacturer balancing complex supply chains, a well-implemented reorder point system can:
- Prevent Costly Stockouts: Keep your production lines running and your customers happy by ensuring you have critical items in stock.
- Optimize Cash Flow: Avoid tying up capital in excess inventory on slow-moving items.
- Reduce Human Error: Automate the repetitive tasks of tracking and ordering, freeing you and your team to focus on growth.
Ultimately, a smart reorder point strategy is more than just a number; it’s a commitment to efficiency, profitability, and customer satisfaction. By understanding its nuances and leveraging the right tools, you can build a resilient supply chain that gives you a genuine competitive advantage.
Related Post:
Safety Stock – Definition, Importance, Formulas & Implementation
There are a few different formulas that go into deciding how much safety stock you have to maintain. These include General formula,…
Read This ArticleFound this helpful? Share it:
A reorder point (ROP) is the minimum inventory level that triggers a replenishment order for a specific item. In essence, it’s a…
A reorder point (ROP) is the minimum inventory level that triggers a replenishment order for a specific item. In essence, it’s a…
A reorder point (ROP) is the minimum inventory level that triggers a replenishment order for a specific item. In essence, it’s a…