Editorial Note: We are an inventory management software provider. While some of our blog posts may highlight features of our own product, we strive to provide unbiased and informative content that benefits all readers.
FSN analysis, an acronym for Fast-moving, Slow-moving, and Non-moving inventory, is a technique used to classify inventory items based on their consumption rate. This classification system helps businesses make informed decisions about their stock levels, order quantities, and inventory carrying costs.
The primary criteria used to categorize items into the three groups are:
- Consumption Rate: The average quantity of an item consumed or expended during a given time interval.
- Average Inventory Stay: The average amount of time an item spends in inventory before being sold or used.
- Demand Pattern: The regularity and predictability of demand for an item.
In inventory management, FSN analysis is a method used to classify inventory items into three categories: fast-moving, slow-moving, and non-moving. This classification is based on the rate at which the items are consumed or sold.
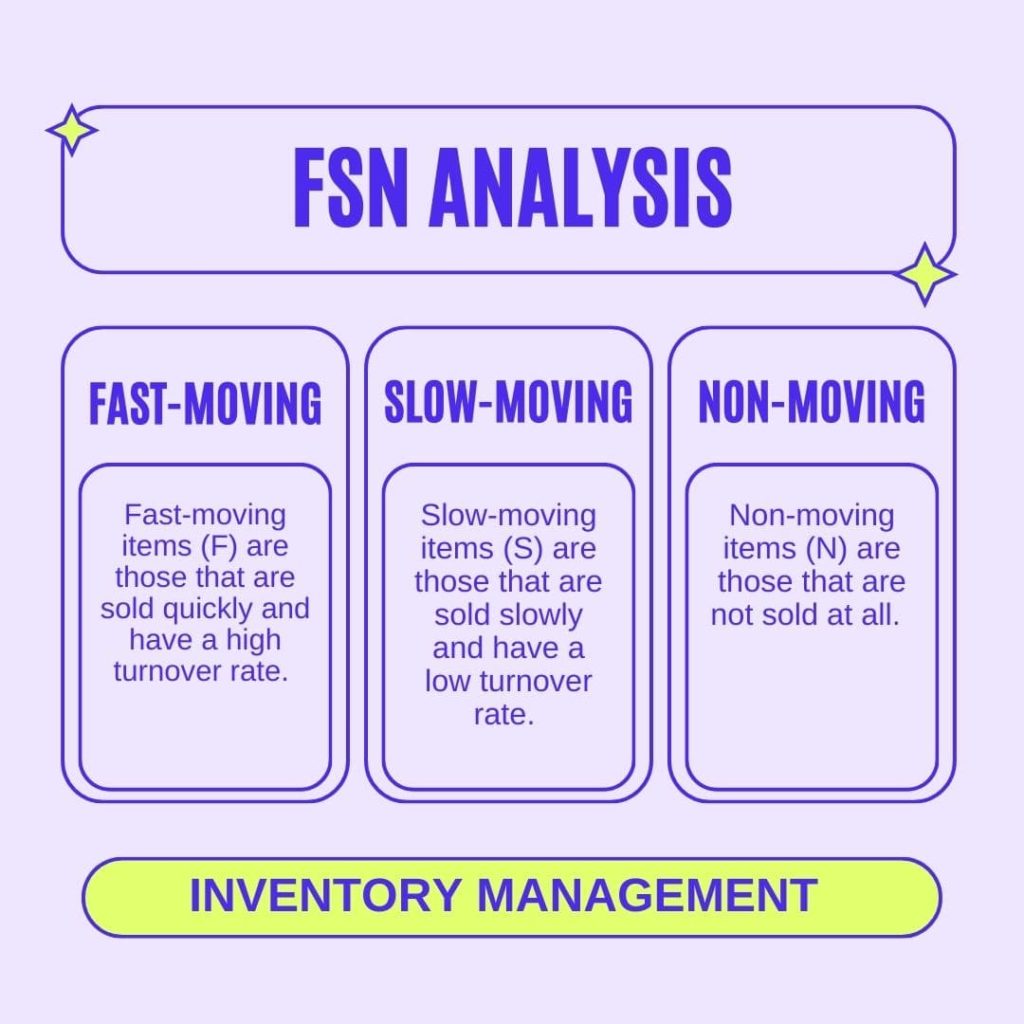
- Fast-moving items (F) are those that are sold quickly and have a high turnover rate. These items typically account for a small percentage of the total inventory value, but they generate a large percentage of the total sales revenue.
- Slow-moving items (S) are those that are sold slowly and have a low turnover rate. These items typically account for a large percentage of the total inventory value, but they generate a small percentage of the total sales revenue.
- Non-moving items (N) are those that are not sold at all. These items are typically dead stock and have a zero turnover rate. They can tie up valuable resources and incur carrying costs, such as storage and insurance.
Regularly conducting FSN analysis is crucial for businesses to adapt to changing market trends, customer preferences, and demand patterns. As demand for certain items fluctuates, businesses can adjust their stock levels, order quantities, and inventory allocation strategies accordingly.
Key Components of FSN Analysis:
Here are the key components of FSN analysis:
1. Forecast Demand
- Forecast demand is the estimated amount of an item that will be sold in a given period.
- It is typically calculated using historical sales data.
- There are a number of different forecasting methods available, such as simple average, moving average, and exponential smoothing.
- The accuracy of the forecast demand is critical for making informed decisions about inventory levels.
2. Safety Stock
- Safety stock is the extra amount of inventory that is kept in stock to protect against unexpected demand fluctuations.
- The amount of safety stock required depends on the variability of demand and the cost of stockouts.
- For example, businesses that sell items with high demand variability or high stockout costs will typically need more safety stock than businesses that sell items with low demand variability or low stockout costs.
3. Reorder Point
- The reorder point is the inventory level at which a new order should be placed.
- It is calculated by taking the lead time to receive a new order and adding it to the safety stock.
- The lead time is the time it takes to receive a new order from a supplier.
- The reorder point is important for ensuring that there is enough inventory on hand to meet demand until the next order arrives.
4. Inventory Review Period
- The inventory review period is the frequency with which inventory levels are reviewed.
- The inventory review period should be based on the demand variability and the cost of carrying inventory.
- For example, businesses that sell items with high demand variability or high carrying costs will typically review inventory more frequently than businesses that sell items with low demand variability or low carrying costs.
5. Inventory Classification
- Inventory classification is the process of grouping inventory items into categories based on their demand and carrying costs.
- This classification can help businesses make informed decisions about stock levels, ordering, and pricing.
- For example, businesses may want to stock high-demand items at higher levels than low-demand items.
- Businesses may also want to offer discounts on slow-moving items to encourage customers to purchase them.
6. Inventory Control System
- An inventory control system is a computer-based system that helps businesses track and manage their inventory.
- These systems can help businesses to:
- Track inventory levels
- Generate forecasts
- Calculate reorder points
- Manage stockouts
- Optimize inventory levels
- Reduce carrying costs
- Increase profits
By implementing FSN analysis and using an inventory control system, businesses can optimize their inventory levels, reduce costs, and increase profits.
In addition to the key components listed above, FSN analysis can also be used to identify and address other inventory management challenges, such as:
- Stockouts: FSN analysis can help businesses to identify items that are at risk of stockouts and take steps to prevent them.
- Overstocking: FSN analysis can help businesses to identify items that are overstocked and take steps to reduce their inventory levels.
- Obsolescence: FSN analysis can help businesses to identify items that are at risk of becoming obsolete and take steps to sell them before they lose value.
FSN analysis is a valuable tool that can help businesses to improve their inventory management practices and achieve their business goals.
Implementation of FSN Analysis in Inventory Management:
Here is a step-by-step guide on how to implement FSN analysis in inventory management:
Step 1: Collect Sales Data
The first step in implementing FSN analysis is to collect sales data for all inventory items. This data should include the item number, description, quantity sold, and date sold. You can gather this data from your point-of-sale (POS) system, inventory management software, or other sales records.
Step 2: Calculate Sales Velocity
Sales velocity is a measure of how quickly an item is selling. It is calculated by dividing the quantity sold by the time period. For example, if an item sells 10 units per month, its sales velocity would be 10 units/month. The higher the sales velocity, the faster the item is selling.
Step 3: Classify Items
Inventory items can be classified into three categories based on their sales velocity:
- Fast-moving (F) items: These items have a high sales velocity and account for a significant portion of sales. They typically have high turnover rates and require frequent replenishment.
- Slow-moving (S) items: These items have a low sales velocity and contribute less to overall sales. They often have lower turnover rates and can remain in stock for longer periods.
- Non-moving (N) items: These items have a zero sales velocity and do not sell at all. They may be obsolete, seasonal, or have been discontinued.
Step 4: Determine Optimal Stock Levels
Once you have classified your inventory items, you can determine the optimal stock levels for each category. For fast-moving items, you will need to maintain higher stock levels than for slow-moving or non-moving items. For slow-moving items, you can safely maintain lower stock levels. And for non-moving items, you should consider discontinuing them or exploring alternative disposal options.
Step 5: Establish Reorder Points
The reorder point is the inventory level at which you should place a new order for an item. To calculate the reorder point, you will need to consider the lead time to receive a new order and the safety stock. The lead time is the time it takes to receive a new order from a supplier. The safety stock is the extra amount of inventory that you keep in stock to protect against unexpected demand fluctuations.
Step 6: Monitor and Review
FSN analysis is not a one-time event. You should regularly monitor your inventory levels and review your classification of items. As sales patterns change, you may need to adjust your stock levels, reorder points, and classification of items.
By implementing FSN analysis, you can optimize your inventory levels, reduce costs, and increase profits.
Additional Tips
Here are some additional tips for implementing FSN analysis:
- Use an inventory management software to help you track sales data and calculate sales velocity.
- Set up alerts to notify you when inventory levels reach reorder points.
- Review your inventory regularly to identify any items that are overstocked or understocked.
- Work with your suppliers to establish good communication and lead times.
- Consider using a just-in-time (JIT) inventory system for fast-moving items.
By following these tips, you can make the most of FSN analysis and improve your inventory management practices.
Benefits of FSN Analysis:
FSN Analysis stands for Fast, Slow, and Non-moving inventory analysis. It is a popular inventory management technique that helps businesses categorize their inventory items into three categories based on how frequently they sell. This information can then be used to make informed decisions about stock levels, ordering, pricing, and promotions.
There are several benefits to using FSN analysis in inventory management:
- Reduced inventory costs: By identifying and classifying slow-moving and non-moving items, businesses can reduce their inventory carrying costs.
- Improved customer satisfaction: By maintaining adequate stock levels of fast-moving items, businesses can avoid stockouts and meet customer demand.
- Increased profits: By optimizing inventory levels and reducing costs, businesses can increase their profits.
Here are some of the specific benefits of FSN analysis:
- Reduced storage costs: Inventory carrying costs, such as the cost of storing, insuring, and financing inventory, can be significant. Slow-moving and non-moving items tie up valuable warehouse space and contribute to these costs. By identifying and addressing these items, businesses can reduce their inventory carrying costs.
- Reduced risk of stockouts: Stockouts occur when a business runs out of a particular item. This can lead to lost sales, customer dissatisfaction, and damage to the business’s reputation. Fast-moving items are more likely to stock out, so businesses need to maintain adequate stock levels of these items. FSN analysis can help businesses identify fast-moving items and make sure they have enough stock on hand to meet demand.
- Reduced obsolescence: Obsolescence occurs when an item becomes outdated or unpopular and can no longer be sold. Non-moving items are at high risk of becoming obsolete. By identifying and addressing these items, businesses can reduce their risk of obsolescence and the associated losses.
- Improved cash flow: Inventory is a significant investment for businesses. By optimizing inventory levels, businesses can free up cash that can be used for other purposes, such as investing in growth or paying down debt.
- Increased inventory turnover: Inventory turnover is the number of times inventory is sold and replaced in a given period. Higher inventory turnover indicates that inventory is being managed efficiently and that businesses are not tying up capital in unnecessary inventory. FSN analysis can help businesses increase their inventory turnover by identifying and addressing slow-moving and non-moving items.
- Improved decision-making: FSN analysis provides businesses with valuable information about their inventory, such as which items are selling quickly, which items are selling slowly, and which items are not selling at all. This information can be used to make informed decisions about stock levels, ordering, pricing, and promotions.
In addition to the benefits listed above, FSN analysis can also help businesses to:
- Identify and manage seasonal items: Seasonal items are items that sell well during a particular time of year, such as holiday decorations or summer clothing. FSN analysis can help businesses identify seasonal items and make sure they have enough stock on hand to meet demand.
- Identify and manage promotional items: Promotional items are items that are offered at a discounted price to encourage sales. FSN analysis can help businesses identify promotional items and make sure they have enough stock on hand to meet demand.
- Identify and manage discontinued items: Discontinued items are items that are no longer being produced or sold. FSN analysis can help businesses identify discontinued items and make sure they are removed from inventory.
FSN analysis is a simple but effective inventory management technique that can provide businesses with a number of benefits. By using FSN analysis, businesses can optimize their inventory levels, reduce costs, improve cash flow, and make better decisions about their inventory.
Examples of FSN analysis:
Example 1
A retail store sells a variety of products, including clothing, electronics, and household goods. The store has been using traditional inventory management methods, but they have been experiencing problems with stockouts and overstocking. They decide to implement FSN analysis to improve their inventory management practices.
The store collects sales data for all of its inventory items for the past year. They then calculate sales velocity for each item and classify them into fast-moving, slow-moving, and non-moving categories.
Based on their analysis, the store determines that 20% of their items are fast-moving, 50% are slow-moving, and 30% are non-moving. They then adjust their stock levels, ordering, and pricing accordingly.
As a result of implementing FSN analysis, the store is able to reduce stockouts by 50%, overstocking by 25%, and inventory carrying costs by 10%. They also experience a 15% increase in sales.
Example 2
A manufacturing company produces a variety of components for other manufacturers. The company has been experiencing problems with keeping up with demand for its most popular components. They decide to implement FSN analysis to improve their inventory management practices.
The company collects sales data for all of its components for the past six months. They then calculate sales velocity for each component and classify them into fast-moving, slow-moving, and non-moving categories.
Based on their analysis, the company determines that 30% of their components are fast-moving, 40% are slow-moving, and 30% are non-moving. They then adjust their production schedule and inventory levels accordingly.
As a result of implementing FSN analysis, the company is able to reduce stockouts by 80%, overstocking by 40%, and inventory carrying costs by 20%. They also experience a 25% increase in sales.
Example 3
A distributor sells a variety of products to retailers. The distributor has been experiencing problems with managing the obsolescence of its products. They decide to implement FSN analysis to improve their inventory management practices.
The distributor collects sales data for all of its products for the past year. They then calculate sales velocity for each product and classify them into fast-moving, slow-moving, and non-moving categories.
Based on their analysis, the distributor determines that 40% of their products are fast-moving, 30% are slow-moving, and 30% are non-moving. They then review their non-moving products and discontinue those that are unlikely to sell in the future.
As a result of implementing FSN analysis, the distributor is able to reduce obsolescence by 50%, overstocking by 30%, and inventory carrying costs by 15%. They also experience a 10% increase in sales.
These are just a few examples of how FSN analysis can be used to improve inventory management. By carefully analyzing their sales data and implementing appropriate strategies, businesses can optimize their inventory levels, reduce costs, and improve profits.
Conclusion:
FSN analysis is a valuable tool for businesses of all sizes that can help to optimize inventory levels, reduce costs, increase profits, improve customer satisfaction, and make better decisions about inventory management. By collecting sales data, calculating sales velocity, classifying inventory items, and adjusting stock levels, ordering, and pricing accordingly, businesses can achieve significant improvements in their inventory management practices.
Key takeaways:
- FSN analysis helps businesses identify and manage fast, slow, and non-moving inventory items.
- FSN analysis can help businesses reduce stockouts, overstocking, and obsolescence.
- FSN analysis can help businesses reduce inventory carrying costs and improve cash flow.
- FSN analysis can help businesses increase profits and improve customer satisfaction.

Take a Quiz Test - Test Your Skill
Test your inventory management knowledge. Short multiple-choice tests, you may evaluate your comprehension of Inventory Management.