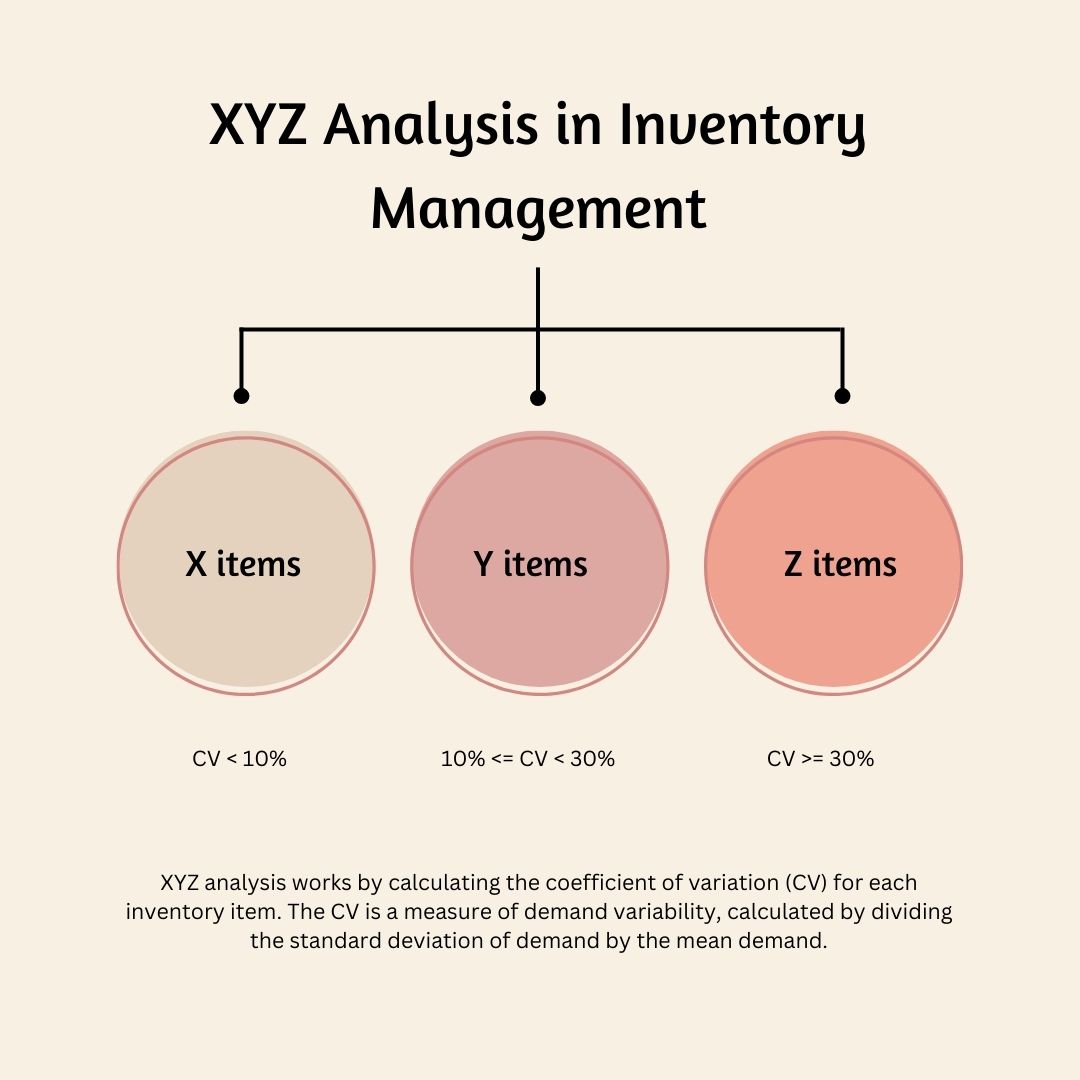
XYZ analysis is a method of inventory classification that groups items based on their demand variability.
XYZ analysis classifies inventory items by how much their demand fluctuates over time, using the coefficient of variation (CV) to quantify variability. By calculating CV for each SKU—dividing the standard deviation of demand by its mean—you sort products into three groups:
- X items (CV < 10 %): Demand is very stable and predictable.
- Y items (10 % ≤ CV < 30 %): Demand shows moderate ups and downs.
- Z items (CV ≥ 30 %): Demand is highly erratic and hard to forecast.

When paired with ABC analysis, which ranks items by annual consumption value (A = highest value, C = lowest), XYZ adds a second dimension—variability—to your inventory view. The resulting nine‐cell ABC–XYZ matrix helps you:
- Prioritize effort on high‐value, high‐variability items (A‐Z) with agile replenishment or vendor‐managed options
- Automate routine items that are both low‐value and stable (C‐X)
- Tailor safety‐stock and reorder rules across all combinations of value and variability for maximum efficiency
By combining value and volatility in a single framework, you ensure each product gets exactly the level of forecasting accuracy, safety‐stock buffer, and replenishment agility it needs—no more, no less.
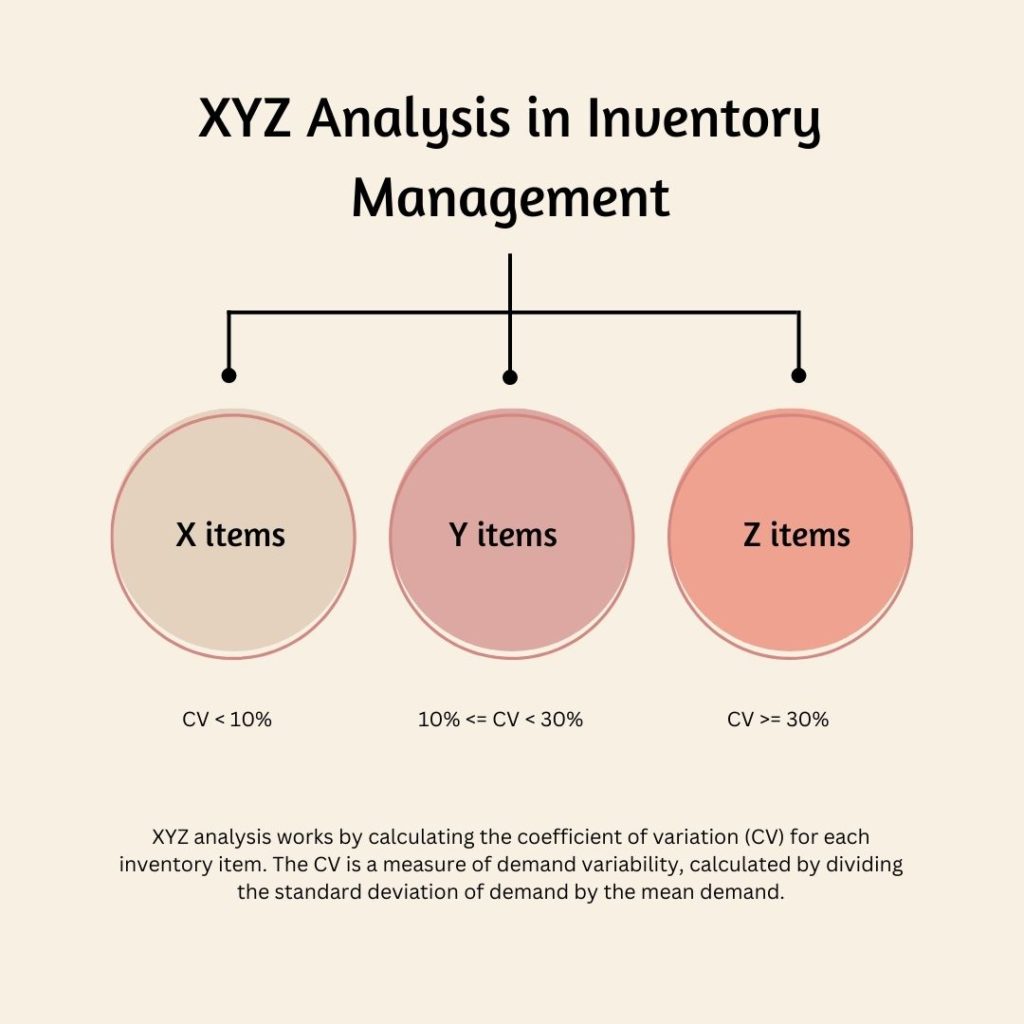
How does XYZ analysis work?
- Look at your sales data. Gather a steady stream of past demand for each product (for example, weekly or monthly sales over the last year).
- Measure how much demand jumps around. For each item, find its average demand and how much the demand varies up and down.
- Turn that into a percentage (the CV). Divide the “how much it wiggles” (standard deviation) by the “where it settles on average” (mean), then multiply by 100.
- Sort items into three buckets by that percentage:
- X items (CV < 10%) – demand barely changes.
- Y items (CV 10–30%) – demand goes up and down a bit.
- Z items (CV > 30%) – demand is all over the map.
- Label each SKU as X, Y, or Z based on its CV.
- Use different stock rules for each:
- X: Keep a steady safety buffer.
- Y: Update your reorder plans regularly.
- Z: Only buy when you see real orders coming in.
That’s it—by turning demand swings into a simple percentage and grouping items, you know exactly which products need tight control and which you can handle more flexibly.

Benefits of XYZ analysis
XYZ analysis offers a number of benefits for businesses, including:
Lower Working Capital & Holding Costs
Companies using inventory-optimization approaches—of which XYZ segmentation is a cornerstone—have cut total inventory by up to 25 % in just one year, freeing capital and slashing storage expenses ( Wikipedia ).
Improved Cash Flow
Those same firms saw their discounted cash flow rise by over 50 % within two years, as cash tied up in volatile or slow-moving items was redeployed to higher-return initiatives ( Wikipedia ).
Lower Distortion Costs
By grouping SKUs by demand variability (X, Y, Z), organizations helped drive a 19.2 % decline in North American out-of-stock costs (from $225.7 B to $182.2 B) between 2020 and 2022 Zebra Technologies—and yet, global inventory distortion still tops $1.77 trillion in losses annually, underscoring the urgent need for precise variability segmentation (Food Institute, 2023) The Food Institute.
Higher Service Levels
For instance, Castrol leveraged demand-variability insights to reduce finished-goods inventory by 35 % over two years while simultaneously boosting line-fill rates by 9 %, ensuring customers find the products they need, exactly when they need them( Wikipedia ).

Classifying inventory items using XYZ analysis
Segmenting your stock by demand variability unlocks smarter replenishment, tighter controls, and leaner working capital. Here’s how to turn raw sales data into clear X, Y and Z categories:
- Crunch the Numbers
- Gather consistent demand data (e.g., weekly sales for 12 months).
- Clean it up by smoothing out one-off spikes (promotions, stock-outs) and filling any gaps.
- Calculate each item’s Coefficient of Variation (CV): This expresses the Coefficient of Variation (CV) as a percentage by dividing the standard deviation of demand by the average demand and then multiplying by 100. CV = (Standard Deviation of Demand ÷ Average Demand) × 100%.
- Define Your Thresholds
- X items (CV < 10%): Demand hardly moves—think staple products with predictable, repeat purchases.
- Y items (10% ≤ CV < 30%): Demand shows some ebb and flow—seasonal lines or items impacted by modest promotions.
- Z items (CV ≥ 30%): Demand is all over the place—new launches, trend-driven SKUs, or products tied to irregular events.
- Label and Visualize
- Tag every SKU in your system with X, Y or Z.
- Plot CV vs. average demand on a scatter chart to spot clusters and outliers—this visual guide helps you tailor policies at a glance.
- Tailor Your Policies
- X items: Keep a consistent safety buffer. Automate reorder points so you never run out of your rock-solid performers.
- Y items: Reforecast regularly—monthly or even weekly. Blend historical trends with short-term indicators like upcoming promotions.
- Z items: Favor “order-on-demand” or just-in-time approaches. Limit pre-stocking to only what’s absolutely sure to sell or test new items with very small pilot orders.
- Review and Refine
- Re-run the analysis quarterly (or more often in fast-changing markets) to catch shifting patterns.
- Adjust thresholds for different product families—what counts as “volatile” in electronics may look totally different in perishables.
By classifying items into X, Y and Z, you’ll know exactly where to tighten the reins, when to give yourself a little wiggle room, and which products to treat with nimble, on-demand sourcing. This clarity reduces stockouts, slashes excess, and turns demand variability from a headache into a strategic advantage.
XYZ Inventory Classification Framework
XYZ analysis segments stock by demand variability — giving you precise control over replenishment, safety stocks, and working capital. Here’s how to classify your items into X, Y, and Z groups for smarter inventory policies.
X Items — Predictable Demand
These products have extremely stable demand (CV < 10%) and form the backbone of your inventory. They rarely deviate from forecasts.
- Examples: Everyday staples, core spare parts, consistent raw materials
- Policy Tips: Keep steady safety stock, automate reorder points, and focus on preventing stockouts
Y Items — Moderate Variability
Demand fluctuates seasonally or due to moderate promotions (10% ≤ CV < 30%). Planning needs to be flexible but still data-driven.
- Examples: Seasonal goods, semi-predictable fashion items, moderately promoted SKUs
- Policy Tips: Reforecast monthly or weekly, blend historical trends with upcoming promotional insights
Z Items — Highly Variable
Unpredictable demand (CV ≥ 30%) often driven by trends, new launches, or irregular events. High risk for overstocking or stockouts.
- Examples: Trend-driven items, product launches, event-specific goods
- Policy Tips: Use just-in-time ordering, keep minimal safety stock, test with small pilot orders before committing
Using XYZ analysis to optimize inventory management
Once you’ve tagged each SKU as X, Y, or Z, you can tailor your inventory policies to match each group’s demand behavior. Here’s how:
1. Smarter Inventory Planning & Forecasting
- X Items (Stable Demand):
- Use simple, low-variance forecasting methods (e.g., moving averages).
- Plan out replenishment on a fixed schedule—weekly or bi‐weekly—knowing you’ll rarely see large swings.
- Y Items (Moderate Variability):
- Combine time‐series forecasting (e.g., exponential smoothing) with short‐term adjustments for upcoming promotions or seasonal peaks.
- Build in a “forecast review” step each month to catch emerging trends.
- Z Items (High Variability):
- Treat forecasts as directional estimates only.
- Lean on signal‐driven triggers—such as real‐time point‐of‐sale data or confirmed customer orders—to avoid large forecast errors.
2. Right-Sizing Safety Stock
Safety stock cushions you against uncertainty—but the right amount varies by category:
| Category | Demand Variability | Safety Stock Strategy |
|---|---|---|
| X | Low (< 10 % CV) | Keep minimal buffer (e.g., 1–2 days’ average). |
| Y | Moderate (10–30 %) | Set buffer for lead‐time variability + 1 σ. |
| Z | High (> 30 % CV) | Limit to critical “just in case” level or zero—rely on fast reorders. |
3. Dynamic Reorder Points
Reorder points (ROP) signal when to trigger your replenishment. XYZ lets you fine‐tune ROP per class:
- X Items: ROP = (Average Daily Demand × Lead Time) + Safety Stock This formula determines the Reorder Point (ROP)—the inventory level at which a new order should be placed. It assumes stable demand and ensures timely replenishment while accounting for safety stock.
- Y Items:
- Add a “variability factor” tied to recent forecast error.
- Example: ROP = (μ × LT) + k × σ_demand
- Where:
- μ = average demand
- LT = lead time
- σ_demand = standard deviation of demand
- k = service level factor (e.g., 1.65 for a 95% service level)
- This version of the reorder point formula accounts for demand variability, making it more suitable for uncertain environments.
- Z Items:
- Use a pull‐based approach: set a near‐zero ROP and reorder only when actual orders push on‐hand stock below the trigger.
- Alternatively, employ very short lead‐time contracts or vendor‐managed inventory so you can respond instantly.
4. Policy Review & Continuous Improvement
- Quarterly Check-Ins: Recompute CVs to capture shifting demand patterns—products can migrate between X, Y, and Z over time.
- Threshold Tuning: Adjust your <10 %/30 % breakpoints for different product families or market conditions.
- Performance Monitoring: Track key metrics (forecast error, fill rate, inventory turns) by XYZ class to validate and refine your settings.
By aligning forecasting methods, safety‐stock buffers, and reorder triggers with each item’s variability profile, XYZ analysis turns one‐size‐fits‐all replenishment into a precision tool—boosting service levels, slashing excess stock, and freeing up working capital where it matters most.
Example of XYZ analysis in inventory management
To see XYZ analysis in action, let’s walk through a simple, three-item example:
| Item | Demand Variability (CV) | XYZ Class | Recommended Strategy |
|---|---|---|---|
| Product A | 5 % | X | • Forecast with a moving average. • Keep safety stock at ~1–2 days of average usage. • Automate replenishment. |
| Product B | 15 % | Y | • Use exponential smoothing with seasonal adjustments. • Set safety stock = lead-time demand + 1 σ. • Review forecasts monthly. |
| Product C | 35 % | Z | • Rely on real-time sales triggers or order-only-on-demand. • Maintain minimal safety stock or zero buffer. • Negotiate very short lead times or vendor-managed inventory. |
Breakdown of the Example
- Product A (X Class)
- Why X? With a CV of just 5 %, its weekly sales barely fluctuate.
- What to do: A simple moving-average forecast will be accurate enough. You can confidently order on a fixed schedule and hold only a small safety buffer (e.g., enough for 1–2 days of sales) to guard against shipment delays.
- Product B (Y Class)
- Why Y? At 15 % CV, demand has some bumps—perhaps mild seasonality or occasional promotions.
- What to do: Implement exponential-smoothing forecasts that pick up trends and seasonality. Calculate safety stock by combining expected lead-time demand with one standard deviation of demand to hit ~95 % service levels. Check and adjust these settings at least monthly.
- Product C (Z Class)
- Why Z? A CV above 30 % means demand jumps unpredictably—maybe it’s a trend-driven SKU or tied to irregular events.
- What to do: Treat forecasts as rough guides only. Use pull-based replenishment (reorder when actual sales occur) or just-in-time contracts. Safety stock should be minimal—rely instead on rapid supplier response or vendor-managed inventory agreements to avoid tying up cash in unpredictable stock.
By mapping this simple three-item case into XYZ categories and tailoring policies accordingly, you transform your inventory system from a one-size-fits-all approach into a precision engine—boosting fill rates on stable sellers, controlling costs on moderate movers, and staying agile on the most volatile products.
Best practices for using XYZ analysis
Here are some best practices for using XYZ analysis:
- Leverage Clean, Representative Historical Data
- Use at least 6–12 months of demand history—weekly or daily—to capture typical variability patterns.
- Remove one-off anomalies (e.g., flash promotions or data-entry errors) so your CV calculations reflect “normal” behavior, not noise.
- Automate & Schedule Regular Reviews
- Demand patterns shift: items can migrate from X→Y (e.g., launching a new promotion) or Y→Z (e.g., becoming a trend).
- Recompute CVs—and update XYZ labels—quarterly (or more often in fast-moving categories) so your segmentation stays current.
- Combine XYZ with ABC for a Holistic View
- Merge value-based (ABC) and variability-based (XYZ) classifications into a nine-cell matrix.
- This lets you prioritize high-value, high-volatility SKUs (A-Z) for special sourcing agreements, while handling low-value, stable SKUs (C-X) with standard automated replenishment.
- Tune Thresholds to Your Industry & Product Families
- The “10 %/30 %” CV breakpoints are a starting point. For fashion, perishables, or seasonal goods, consider raising the X/Y and Y/Z cutoffs to spread items more evenly across categories.
- Apply different thresholds per product line (e.g., electronics vs. consumables) if their demand behaviors differ significantly.
- Incorporate Lead-Time and Service Objectives
- Use the Right Forecasting & Replenishment Methods per Class
- X items: Simple moving-average or level-based methods; fixed reorder cycles.
- Y items: Exponential smoothing with seasonality; dynamic reorder points adjusted for recent forecast errors.
- Z items: Pull-based or just-in-time ordering triggered by real sales; small “test” orders for new or highly erratic products.
- Visualize & Monitor Key Metrics by XYZ Class
- Track forecast accuracy (MAPE or RMSE), fill rates, and inventory turns separately for X, Y, and Z groups.
- Dashboards that slice these KPIs by XYZ category help you spot where policies are underperforming and need adjustment.
- Blend with Root-Cause Analysis for Z-Class SKUs
- High variability often stems from seasonality, promotional spikes, or supply disruptions.
- For persistent Z items, dig deeper: is this a temporary fad or a structural issue? Use insights to stabilize demand (e.g., staggered promotions) or reconsider SKU rationalization.
- Align Cross-Functional Teams
- Share XYZ insights with procurement, sales, and marketing.
- Coordinate promotions and new-product launches with supply-chain capabilities—knowing which items can tolerate variability and which require strict controls.
- Continuously Refine Your Approach
- Treat XYZ analysis as a living process, not a one-off project.
- Solicit regular feedback from inventory planners, demand forecasters, and warehouse managers to refine thresholds, policies, and tools.
By following these best practices, you’ll ensure XYZ analysis remains a powerful, dynamic tool—guiding you to the right replenishment strategies, minimizing costly overstocks or stockouts, and keeping your inventory costs in check.
Conclusion
XYZ analysis transforms raw demand data into clear, actionable insights, allowing you to tailor forecasting, safety‐stock buffers, and replenishment triggers to each product’s behavior.
By grouping your SKUs into stable (X), moderately variable (Y), and highly erratic (Z) categories, you can deploy the right inventory policies—tight controls for your rock‐solid performers, adaptive forecasts for those with some ebb and flow, and on‐demand sourcing for the most unpredictable items. This targeted approach not only sharpens forecast accuracy and minimizes both stockouts and overstocks but also frees up working capital and elevates service levels.
In today’s fast-moving markets, XYZ analysis isn’t just a one-off exercise; it’s a continuous, data-driven discipline that turns demand variability from a challenge into a strategic advantage.
Found this helpful? Share it:
XYZ analysis is a method of inventory classification that groups items based on their demand variability. XYZ analysis classifies inventory items by…
XYZ analysis is a method of inventory classification that groups items based on their demand variability. XYZ analysis classifies inventory items by…
XYZ analysis is a method of inventory classification that groups items based on their demand variability. XYZ analysis classifies inventory items by…