FIFO vs Weighted Average Cost: Same Sales, Different Profit (Worked Example)
One month of purchases and sales for a hypothetical mug shop, costed under FIFO and under moving weighted average. You see where the profit gap comes from and how to choose a method.
On this page
- Key takeaways
- How FIFO and weighted average cost work
- FIFO (first in, first out)
- Weighted average cost
- Worked example: FIFO vs weighted average side by side
- The month’s purchases and sales
- FIFO costing
- Moving weighted average costing
- Same sales, different profit
- Why the gap appears, and when it reverses
- When to choose FIFO and when to choose weighted average
- Choose FIFO when
- Choose weighted average when
- Rules that apply either way
- Steps to cost one item both ways
- Checklist: document your costing policy
- Common mistakes with FIFO and weighted average
- Edge cases generic answers skip
- Selling before the stock is received
- Supplier price corrections after the sale
- Customer returns
- Several locations
- Periodic average
- Opening balances when you migrate
- How to do this in Cash Flow Inventory
- Frequently asked questions
- Which gives higher profit, FIFO or weighted average?
- Is weighted average the same as average cost?
- Can I switch from FIFO to weighted average?
- Is LIFO allowed instead?
- Does my cost method have to match how I physically pick stock?
- Which method is better for a small shop?
FIFO costs each sale at the oldest purchase prices still in stock. Weighted average costs each sale at the blended average of everything on hand. When purchase prices are rising, FIFO reports lower cost of goods sold and higher profit than weighted average for exactly the same sales, and it puts a higher value on the stock you have left.
This page works through one month of purchases and sales for a hypothetical shop, costed both ways. Every number is shown and adds up, so you can see exactly where the profit gap comes from.
You also get the formulas, a copy-ready checklist for choosing and documenting a method, the edge cases that generic answers skip, and how to check the result in Cash Flow Inventory.
Key takeaways
- FIFO and weighted average never change your total costs. They only change how those costs are split between cost of goods sold (this period) and closing stock (next period).
- In the worked example below, the same 370 mugs sold for $3,700 give a gross profit of $2,002 under FIFO and $1,982 under moving weighted average. The $20 gap sits exactly in closing stock.
- Rising costs favour FIFO profit. Falling costs reverse the gap. Stable costs make the two methods almost identical.
- IAS 2 allows both methods but not LIFO. Whichever you pick, use it for all similar stock and do not switch to manage profit.
- Most errors come from late or backdated receipts, missing freight and duty, and selling stock before its receipt is recorded, not from the choice of method itself.
How FIFO and weighted average cost work
Both methods answer one question: when you sell a unit, what did it cost? You usually cannot tell which physical mug or bottle left the shelf, so you use a cost formula. The formula sets cost of goods sold (COGS) on the profit and loss, and the value of stock on the balance sheet.
FIFO (first in, first out)
Each purchase forms a cost layer, with a quantity and a unit cost. When you sell, you use up the oldest layer first, then the next one. What remains in stock is always the most recent purchases.
FIFO COGS = sum of (units taken from each layer × that layer's unit cost), oldest layer first
Weighted average cost
All units of an item share one average cost. There are two versions, and they give different answers.
- Moving (perpetual) average: the average is recalculated after every receipt. Each sale is costed at the average on that date. This is the version that inventory software running live stock records uses.
- Periodic average: one average for the whole period, worked out at period end. Every sale in the period gets the same cost.
New moving average cost = (value on hand + cost of new receipt) ÷ (units on hand + units received)
Periodic average cost = (opening stock value + purchases in period) ÷ (opening units + units purchased)
The IAS 2 Inventories standard permits FIFO and weighted average for interchangeable items. It requires specific identification for items that are not interchangeable, and it does not permit LIFO. US rules are different. The IRS Publication 538 on accounting periods and methods describes FIFO, LIFO and other inventory identification methods for US tax.
Worked example: FIFO vs weighted average side by side
Example: a shop selling ceramic mugs. This is a hypothetical business with one SKU, a standard 350 ml mug sold at $10 each. Supplier prices rise during the month. All figures exclude sales tax.
The month’s purchases and sales
| Day | Event | Units | Unit cost | Total cost |
|---|---|---|---|---|
| 1 | Opening stock | 100 | $4.00 | $400 |
| 5 | Purchase 1 | 200 | $4.60 | $920 |
| 10 | Sale 1 | 220 | sold at $10 | revenue $2,200 |
| 15 | Purchase 2 | 120 | $5.40 | $648 |
| 25 | Sale 2 | 150 | sold at $10 | revenue $1,500 |
| Totals | 420 available, 370 sold, 50 left | $1,968 cost available, $3,700 revenue |
FIFO costing
| Sale | Layers used | Cost |
|---|---|---|
| Sale 1 (220 units) | 100 × $4.00 = $400; 120 × $4.60 = $552 | $952 |
| Sale 2 (150 units) | 80 × $4.60 = $368; 70 × $5.40 = $378 | $746 |
| Total COGS | $1,698 | |
| Closing stock | 50 × $5.40 | $270 |
Moving weighted average costing
| Day | Step | Units on hand | Value on hand | Average cost |
|---|---|---|---|---|
| 5 | After Purchase 1: $400 + $920 | 300 | $1,320 | $4.40 |
| 10 | Sale 1: 220 × $4.40 = $968 | 80 | $352 | $4.40 |
| 15 | After Purchase 2: $352 + $648 | 200 | $1,000 | $5.00 |
| 25 | Sale 2: 150 × $5.00 = $750 | 50 | $250 | $5.00 |
Total COGS under moving average is $968 + $750 = $1,718. Closing stock is $250.
Same sales, different profit
| Line | FIFO | Weighted average | Difference |
|---|---|---|---|
| Revenue | $3,700 | $3,700 | $0 |
| Sale 1 COGS | $952 | $968 | −$16 |
| Sale 2 COGS | $746 | $750 | −$4 |
| Total COGS | $1,698 | $1,718 | −$20 |
| Gross profit | $2,002 | $1,982 | +$20 |
| Gross margin | 54.1% | 53.6% | +0.5 points |
| Closing stock | $270 | $250 | +$20 |
| COGS + closing stock | $1,968 | $1,968 | $0 |
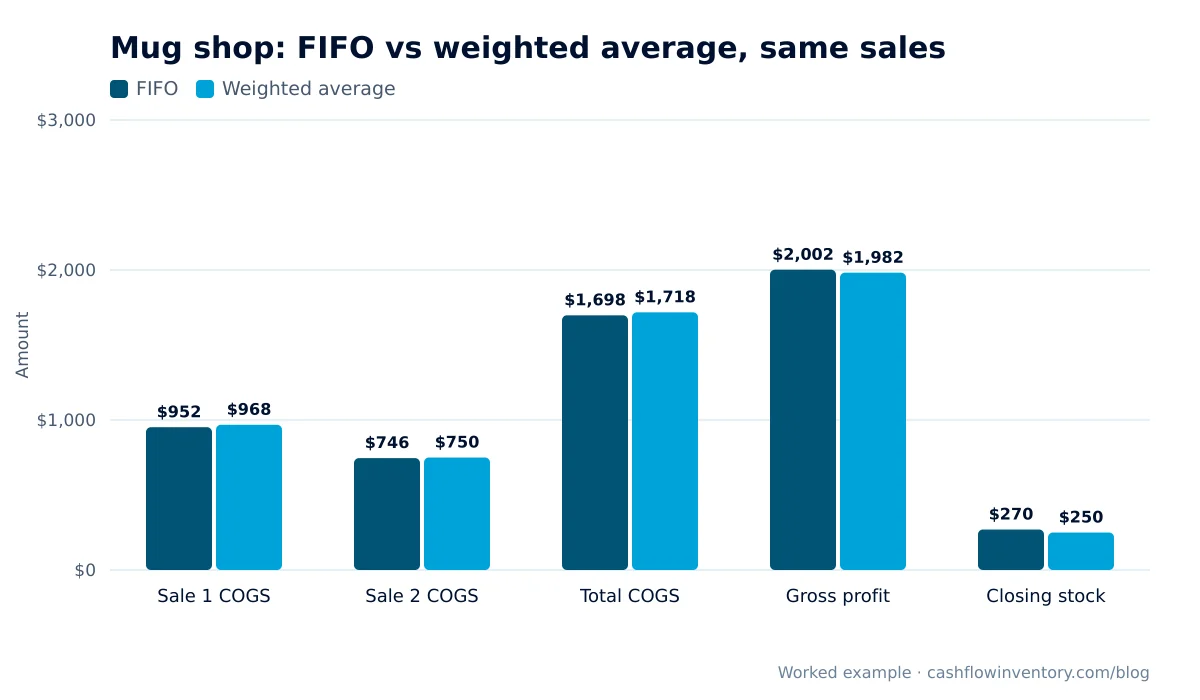
Look at the last row. Both methods account for the same $1,968 of cost. FIFO simply leaves $20 more of it on the shelf, valued at the latest price of $5.40, and so shows $20 more profit this month. Next month, that extra $20 flows into COGS when those 50 mugs sell.
Twenty dollars looks trivial on one SKU. Repeat it across hundreds of items, a year of rising supplier prices and a business that pays tax on profit, and the timing difference becomes real cash. You can test your own figures with the gross margin calculator.
Why the gap appears, and when it reverses
The direction of the gap depends only on the direction of costs.
- Costs rising: FIFO charges the older, cheaper layers to COGS. Profit is higher and closing stock is higher.
- Costs falling: FIFO charges the older, dearer layers. Profit is lower than under weighted average.
- Costs flat: both methods give almost the same answer.
- Costs volatile: weighted average smooths the swings. FIFO passes each spike into COGS when that layer sells.
That smoothing is the practical difference you will notice in margins. If you price on a markup over cost, weighted average gives you a steadier cost figure to price from. FIFO shows a margin that lags behind supplier price changes, sometimes by weeks for slow movers.
When to choose FIFO and when to choose weighted average
Use these rules as a starting point, then confirm with your accountant for your country and framework.
Choose FIFO when
- Your stock is perishable or dated, such as food, cosmetics or medicines, so oldest-first already matches how goods move.
- You buy in distinct batches at clearly different prices and want closing stock valued close to current replacement cost.
- Lenders or investors read your balance sheet and you want stock values that look current.
- You report under IFRS and want the most common, easily audited method.
Choose weighted average when
- Units are mixed together and cannot be separated by batch, such as bulk liquids, grains, fasteners or loose fabric.
- You buy often, in small lots, at prices that move up and down.
- You want steady unit costs for pricing and quoting.
- Many receipts and sales a day would make FIFO layers hard to explain to staff.
Rules that apply either way
- Use the same formula for all stock of a similar nature and use. Do not run FIFO on one blue mug and weighted average on the identical red one.
- Do not switch to dress up a weak quarter. Under IFRS, a voluntary policy change needs a better-information reason and is applied retrospectively. In the US, a change of inventory method for tax generally needs consent through IRS Form 3115.
- Your physical picking order and your cost formula do not have to match. A pharmacy can pick by expiry date and still value stock at weighted average.
Steps to cost one item both ways
Run this test on one high-volume SKU before you commit to a method or migrate systems.
- Pick one SKU and one month. Note the opening units and opening value.
- List every receipt with its date, quantity and full landed unit cost, including freight, duty and non-reclaimable taxes.
- List every sale and customer return with its date and quantity, in date order.
- For FIFO, build the layers and consume them oldest first, sale by sale.
- For moving average, recalculate the average after every receipt and cost each sale at the average on its date.
- Check that COGS plus closing stock equals opening value plus purchases under both methods. If it does not, you have missed a line.
- Compare gross profit and closing stock. Multiply the gap across your range to see what is at stake.
Checklist: document your costing policy
- Cost formula chosen: FIFO or weighted average (moving or periodic).
- Item groups it applies to, and any items on specific identification.
- What goes into unit cost: purchase price, freight in, import duty, non-reclaimable tax, handling.
- What stays out: storage, selling costs, abnormal waste and reclaimable VAT or GST.
- How customer returns are costed: at the original sale cost or the current average.
- How supplier returns and supplier credit notes adjust cost.
- Write-down rule for damaged, slow or obsolete stock (lower of cost and net realisable value under IFRS).
- Cut-off rule: receipts recorded on the day goods arrive, never backdated after sales.
- Who approves stock adjustments, and when the period is locked.
- Date adopted, accounting framework and who signed it off.
Common mistakes with FIFO and weighted average
- Leaving landed costs out. If freight and duty are booked as an overhead expense instead of added to stock, both methods understate unit cost and overstate margin on every sale.
- Recording receipts late. If Purchase 2 in the example had been entered on day 26 instead of day 15, Sale 2 would still be costed at $4.40 under moving average. Its COGS would be $660 instead of $750, so profit would be overstated by $90 until the receipt is posted.
- Using the last purchase price as “cost”. That is neither FIFO nor weighted average. It inflates COGS when prices rise.
- Mixing methods across similar items, often after an import from two old systems.
- Comparing margins across a method change without restating the earlier period. The improvement is an artefact, not a better business.
- Forgetting write-downs. Neither method protects you from carrying unsaleable stock at cost. Pair your costing with a markdown policy and review slow movers.
Edge cases generic answers skip
Selling before the stock is received
Negative stock breaks both methods. FIFO has no layer to draw from, and moving average divides by zero or by a negative quantity. Record receipts first. If a sale must go out early, correct the cost once the receipt is posted.
Supplier price corrections after the sale
If a supplier invoice arrives higher than the purchase order and part of the stock has already sold, the difference belongs partly in COGS and partly in stock. Under weighted average, many businesses spread it over units still on hand. Agree a rule and apply it consistently.
Customer returns
Returned goods should come back at the cost they left at. Under weighted average, bringing them back at today’s average quietly shifts profit between periods.
Several locations
Decide whether the average is per location or across the business. Transfers between warehouses should move cost, not create margin.
Periodic average
With periodic averaging, the example gives $1,968 ÷ 420 ≈ $4.69 for every unit sold all month. That is a third answer, close to but not equal to the moving average. Do not mix it with a perpetual system.
Opening balances when you migrate
Bring each SKU in at its true cost under your chosen method. Under FIFO that may mean several layers, not one blended figure. A blended opening cost is in effect weighted average, and it will distort your first months of margin.
How to do this in Cash Flow Inventory
Cash Flow Inventory posts a journal from every document as it happens, including bills, invoices and stock movements. Your COGS and stock balances therefore stay current without month-end re-keying. Use the steps below to set up the books and check one item against the worked example method.
- Set your framework. In Settings › General, set the Accounting framework: IFRS, IFRS for SMEs, US GAAP, UK / Ireland FRS 102, Ind AS or National GAAP. This sets the captions and policies your statements follow.
- Check the chart. Open Accounting › Chart of accounts and confirm that your inventory and cost of sales accounts are in place. Standard accounts… adds any standard accounts your chart is missing. See the chart of accounts and general ledger guide.
- Record in date order. Enter receipts on the day the goods arrive, before the sales that use them. The stock movements log lists every receipt, sale, transfer, adjustment and count, newest first, with who made it and the document. Use it to rebuild the sequence for your test SKU.
- Read the result. Open Finance › Reports, choose Profit and loss, pick the period and the location, and use Compare with the previous period. Open Balance sheet for the stock value on the closing date. See the financial statements guide.
- Trace the cost. Use the General ledger report, or Accounting › Transactions, to follow each cost of sales line back to its document. Then reconcile it against your hand calculation from the steps above.
- Correct cleanly. If an adjustment is needed, post it in Accounting › Journals with New journal and attach your working. Editing a manual journal reverses the original and posts the new one, and the period lock applies, so the audit trail stays intact.
Pin the Profit and loss as a KPI on your dashboard and schedule it by e-mail each month. A sudden margin jump on a stable product is often a late receipt, not a better month.
More on how stock and the ledger fit together is on the inventory accounting software page.
Frequently asked questions
Which gives higher profit, FIFO or weighted average?
When purchase costs are rising, FIFO gives higher profit because it charges the older, cheaper units to cost of goods sold. When costs are falling, weighted average gives higher profit. Over the full life of the stock, total profit is the same. Only the timing differs.
Is weighted average the same as average cost?
Yes, the terms are used interchangeably. Check whether someone means the moving average, recalculated after each receipt, or the periodic average, calculated once per period. The two give different COGS, as the edge case above shows.
Can I switch from FIFO to weighted average?
You can, but only for a good reason, such as giving more reliable information, and not to manage profit. Under IFRS, the change is applied retrospectively with prior figures restated. For US tax, a change of method generally needs IRS consent, so speak to your accountant first.
Is LIFO allowed instead?
Not under IFRS, which most countries outside the US use for company accounts. LIFO is allowed under US GAAP and US tax rules, subject to conditions. Most small businesses outside the US choose between FIFO and weighted average.
Does my cost method have to match how I physically pick stock?
No. The cost formula is an accounting assumption. You can pick by expiry date, which suits perishables and medicines, and still value stock at weighted average, provided you apply the formula consistently.
Which method is better for a small shop?
If your items are interchangeable and you restock often at changing prices, moving weighted average is simpler to explain and gives steadier margins. If you sell dated goods in clear batches, FIFO matches reality and keeps stock values current. Either is fine when it is applied consistently with full landed costs.
Whichever method you choose, the numbers are only as good as the order and completeness of your receipts and sales. To see live cost of sales, stock value and profit come out of every document you post, start a free trial and run the one-SKU test from this page on your own data.