
When to Switch From Excel to Inventory Software: 9 Measurable Signs
Score your spreadsheet on nine measurable signs, then compare what staying on Excel costs you each month with what moving would cost. Includes a worked example and copy-ready decision rules.
On this page
- Key takeaways
- Why Excel stops working for inventory (and when it is still fine)
- The 9 measurable signs: score your business today
- Copy-ready scorecard: when to switch from Excel to inventory software
- Decision rules for your total
- Override rules that beat the total
- How to calculate the cost of staying on Excel
- Worked example: the cost of staying vs moving
- Steps to decide and switch without disrupting sales
- Common mistakes when moving from Excel to inventory software
- Edge cases the score does not capture
- Few SKUs, high value per item
- Many SKUs, almost no movement
- Seasonal businesses
- Your accountant wants spreadsheets
- Makers and manufacturers
- How to do this in Cash Flow Inventory
- Frequently asked questions
- How many products is too many for an Excel inventory spreadsheet?
- Is Google Sheets better than Excel for inventory?
- Can I keep using Excel alongside inventory software?
- How long does it take to switch from Excel to inventory software?
- Is inventory software worth it for a very small business?
- What should I do before migrating my spreadsheet?
Switch from Excel to inventory software when the spreadsheet costs you more each month than software would. In practice, that point usually comes when you spend more than six hours a week keeping the file up to date, run out of items the sheet says you have, or sell from more than one location or channel.
The clearest test is a score. Rate your business on nine measurable signs, from 0 to 2 each. If you reach 11 or more out of 18, staying on the spreadsheet is very likely costing you more than moving would.
On this page you get the nine-sign scorecard with thresholds, a formula for the monthly cost of staying, and a fully worked example with every figure checked. You also get decision rules, the edge cases that override the score, and the exact steps to move a spreadsheet business into Cash Flow Inventory.
Key takeaways
- Score yourself on nine signs: hours spent, stock-outs, count variance, locations, channels, SKUs, editors, tracking needs and how long it takes to answer basic stock questions.
- A total of 0–5 means tidy up your spreadsheet. A total of 6–10 means plan a move within a quarter. A total of 11 or more means move now.
- Three signs override the total: selling the same stock on several channels, stock in more than one place, and a legal need to trace batches, expiry dates or serial numbers.
- Compare the full monthly cost of staying with the full cost of moving. Staff time, lost sales, errors, shrinkage and excess stock all count, not just the subscription.
- Count your stock before you migrate. Software fed with wrong opening figures repeats the spreadsheet’s mistakes faster.
Why Excel stops working for inventory (and when it is still fine)
Excel is a good first inventory system. It is free or already paid for, flexible, and everyone on your team can open it. If you run one shop with a few hundred items and one person updates the file, a well-built sheet can serve you for years. Our guide to Excel inventory management covers how to get the most out of it.
The problem is structural, not cosmetic. A spreadsheet stores a number in a cell, and anyone can overwrite it. It does not know that a sale happened, that a transfer is in transit, or that two people edited the same row. Each of those gaps turns into a cost: time spent reconciling, sales lost to phantom stock, and money tied up in items you over-ordered because you did not trust the figures.
Row limits are rarely the real constraint. Excel allows 1,048,576 rows per worksheet according to Microsoft’s Excel specifications and limits. Businesses outgrow the spreadsheet long before they reach that number, because the limit that matters is human: how many changes a day one person can type in correctly.
The 9 measurable signs: score your business today
Use last month’s figures. Where you do not track a number, estimate it honestly and write down how you estimated it. Score each sign 0, 1 or 2, then add up the total.
Copy-ready scorecard: when to switch from Excel to inventory software
| # | Sign (measure it like this) | 0 points | 1 point | 2 points |
|---|---|---|---|---|
| 1 | Hours per week spent updating, fixing and reconciling the stock sheet | Under 3 | 3–6 | More than 6 |
| 2 | Stock-outs per month on items you meant to keep in stock | 0–1 | 2–4 | 5 or more |
| 3 | Share of SKUs where a physical count differs from the sheet | Under 2% | 2–5% | Over 5% |
| 4 | Places stock is held (shops, warehouses, stockrooms counted separately) | 1 | 2 | 3 or more |
| 5 | Sales channels drawing on the same stock (shop, own website, marketplace, wholesale) | 1 | 2 | 3 or more |
| 6 | Active SKUs, counting each size and colour as one | Under 150 | 150–500 | Over 500 |
| 7 | People who edit the file in a normal week | 1 | 2–3 | 4 or more |
| 8 | Batch, expiry or serial number tracking | Not needed | Useful for some items | Required by law, customers or warranty |
| 9 | Time to answer “what is my stock worth and what must I reorder today?” | Under 15 minutes | 15–60 minutes | Over an hour |
Decision rules for your total
- 0–5: stay on Excel, but tighten it. Add reorder points and a running log of movements. Our inventory spreadsheet template with reorder alerts is a good starting point. Score yourself again in three months.
- 6–10: plan the move within a quarter. Work out the cost of staying (next section), shortlist tools, and pick a quiet month to migrate.
- 11–18: move now. Every month you wait costs you the gap you are about to calculate.
Override rules that beat the total
Some situations justify a switch even when your total is low:
- You score 2 on sign 5 (three or more channels). Two channels selling the same last unit leads to overselling, and a spreadsheet cannot stop it in real time.
- You score 2 on sign 8 (tracking required). If a regulator or customer can ask which batch went to whom, you need records that cannot be overwritten.
- You score 2 on sign 4 (three or more locations) and move stock between them weekly. Transfers in transit are where spreadsheets lose items.
How to calculate the cost of staying on Excel
The score tells you whether to move. The cost tells you how urgent it is, and whether the subscription pays for itself. Put a monthly figure on each problem the scorecard surfaced:
Monthly cost of staying = (hours × hourly staff cost) + (stock-outs × average gross profit lost per stock-out) + (errors × average cost per error) + shrinkage written off + (excess stock value × monthly carrying rate)
- Hours × hourly staff cost: use the real cost of whoever does the work, including your own time if you are the owner.
- Gross profit lost per stock-out: the profit on the sales you missed, not the revenue. Our gross margin calculator gives you the margin.
- Cost per error: re-shipping, refunds, courier returns and the time spent fixing a wrong order or an oversell.
- Shrinkage: what you wrote off after your last count. If you have not counted, see how to run a proper stock take.
- Excess stock × carrying rate: stock you hold beyond what you need, multiplied by your monthly holding cost. Our guide to inventory carrying cost shows how to estimate the rate.
Then compare that figure with the cost of moving:
Payback in months = one-off switching cost ÷ (monthly cost of staying − monthly cost remaining after switching − monthly subscription)
For subscription levels and hidden costs to include, read how much inventory software costs.
Worked example: the cost of staying vs moving
Example: a shop selling phone cases and accessories. This business is hypothetical. It has two shops, its own website and a marketplace store, with 420 active SKUs across all variants. Three people edit one shared spreadsheet. Figures are in US dollars per month; swap in your own currency and rates.
Its score:
- 8 hours a week on the sheet = 2
- 8 stock-outs = 2
- 6% count variance = 2
- 2 locations = 1
- 3 channels = 2
- 420 SKUs = 1
- 3 editors = 1
- No tracking needed = 0
- 2 hours to answer stock value and reorders = 2
Total: 13 out of 18. The decision rule says move now, and the channel override applies as well.
Assumptions:
- Staff cost is $10 an hour.
- Each stock-out loses $40 of gross profit.
- Each order error costs $15.
- Carrying cost is 2% of excess stock value per month.
- The software subscription is assumed at $60 a month. This is a placeholder, so check real prices.
- Switching takes 36 hours of counting, cleaning data and training: 36 × $10 = $360, spread over 12 months as $30 a month.
| Cost line | How it is worked out | Staying on Excel | After switching |
|---|---|---|---|
| Staff time on stock records | 32 h → 14 h × $10 | $320 | $140 |
| Lost profit from stock-outs | 8 → 4 stock-outs × $40 | $320 | $160 |
| Order and oversell errors | 12 → 4 errors × $15 | $180 | $60 |
| Shrinkage written off | From count results | $150 | $100 |
| Carrying cost of excess stock | $7,200 → $4,800 × 2% | $144 | $96 |
| Operating cost subtotal | $1,114 | $556 | |
| Software subscription (assumed) | $0 | $60 | |
| Switching cost spread over 12 months | $360 ÷ 12 | $0 | $30 |
| Total monthly cost | $1,114 | $646 |
Result:
- Moving saves $1,114 − $646 = $468 a month, or $5,616 in the first year.
- Payback on the one-off cost is $360 ÷ ($1,114 − $556 − $60) = $360 ÷ $498 = 0.72 months, so the move pays for itself within the first month.
- Over 12 months, staying costs $13,368 (12 × $1,114). Moving costs $7,752 (12 × $616, plus the $360 one-off).
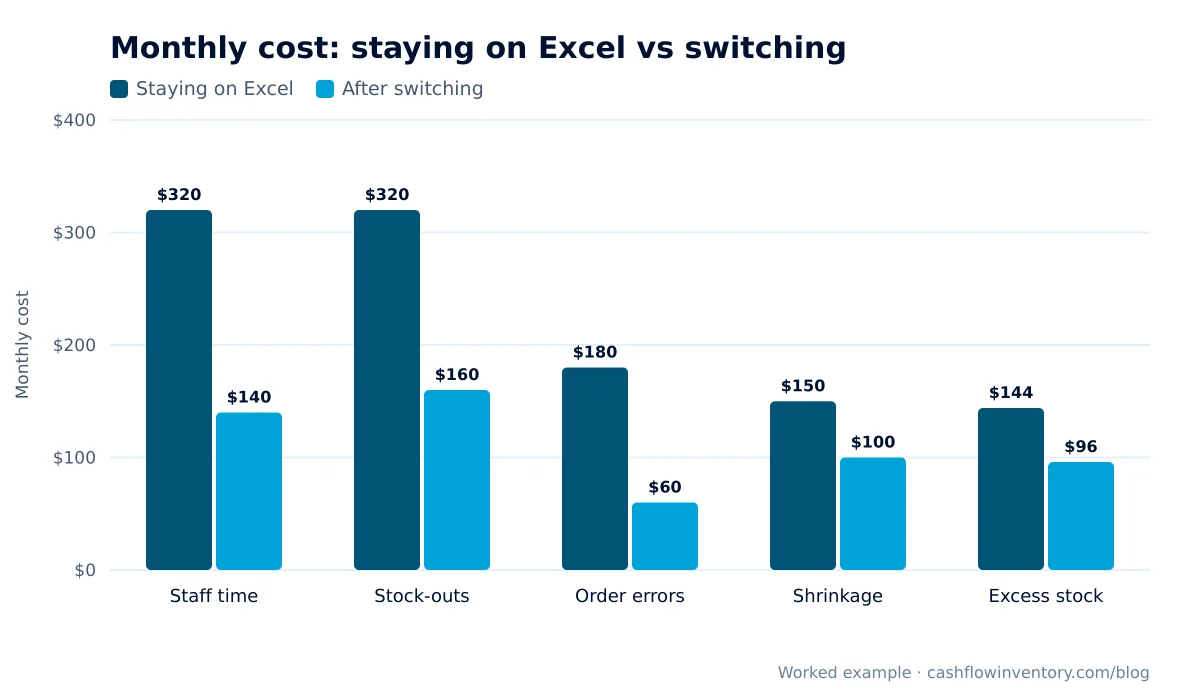
Notice where the money is. The subscription is the smallest line in the table. Staff time and stock-outs are the largest, which is why comparing software prices alone gives the wrong answer.
The “after” figures are assumptions too, so be conservative with yours. If the move still pays back within six months with modest improvements, it is a sound decision.
Steps to decide and switch without disrupting sales
- Score yourself today with the scorecard above, using last month’s numbers.
- Price the cost of staying with the formula. Use real hourly costs and gross profit, not revenue.
- List your must-haves from the signs you scored 2 on. For example: multi-location stock, marketplace sync, batch tracking or reorder suggestions. Our page on choosing inventory software helps you turn that list into questions for vendors.
- Clean your data before you import. Give each SKU one code, merge duplicates, standardise sizes and colours, and delete discontinued items with zero stock.
- Count your stock at every location as close to go-live as you can. These counts become your opening stock.
- Pick a quiet week to go live. Avoid month-end, peak season and the week of a big supplier delivery.
- Run sales and purchases in the software from day one. Keep the old spreadsheet read-only for reference, not as a parallel system.
- Score yourself again after 60 days. Compare the new hours, stock-outs and count variance against your starting figures.
Common mistakes when moving from Excel to inventory software
- Comparing only the subscription with “free”. Excel is not free when it uses 32 hours a month of paid time.
- Importing the spreadsheet’s stock figures without counting. If your sheet is off on 6% of SKUs, the new system starts off on 6% of SKUs. Count first, and record any differences as adjustments with a reason. Our stock-taking guide explains how.
- Running both systems in parallel for months. Two sources of truth means neither is trusted. One or two weeks of reference checking is enough.
- Switching on every feature at once. Start with products, locations, purchases and sales. Add batches, units or production when you need them.
- Going live in your busiest season. Staff learn slower under pressure, and early mistakes cost more.
- Not giving people the right access. In a shared spreadsheet everyone can see costs and margins. In software, decide who needs which rights before you invite them.
Edge cases the score does not capture
Few SKUs, high value per item
A jeweller or electronics reseller with 80 SKUs may score low on sign 6. However, one missing item can cost more than a month of software. If you need serial numbers for warranty claims, treat sign 8 as a 2 and switch.
Many SKUs, almost no movement
A spare-parts seller with 3,000 slow-moving SKUs and one person may score 2 on sign 6 and little else. A well-built spreadsheet can work here for a while. The real question is whether you can see what is dead stock. If you cannot, the excess-stock line in your cost formula will be large.
Seasonal businesses
Score your peak month, not your average month. A business that scores 4 in March and 12 in November should switch, and should do it before the peak arrives.
Your accountant wants spreadsheets
That is a reporting preference, not a reason to run stock in Excel. Records you can export are fine. What tax authorities generally expect is records that are complete and supportable; see, for example, the IRS guidance on recordkeeping. If you value inventory under IFRS, IAS 2 Inventories sets the cost formulas, such as FIFO and weighted average. Applying these consistently by hand across hundreds of receipts is error-prone.
Makers and manufacturers
If you turn raw materials into finished goods, a spreadsheet has to subtract components and add finished stock in separate places. Add a point to sign 1 for every recipe you maintain by hand.
How to do this in Cash Flow Inventory
Cash Flow Inventory’s getting started guide is written for businesses moving from spreadsheets or other software. Here is the move for a shop like the example above.
- Sign up. Enter your business name, your name, your e-mail and a password, and choose your country and type of business. Confirm your e-mail; the link works for 7 days. Your country sets the currency, time zone, fiscal year, tax and a starting chart of accounts, and your first location (Head office) is created for you.
- Accept your business type. On Dashboard › Overview, use the Getting started card. Choose Set up to accept the suggested type, or Choose another.
- Choose your mode. In Settings › Business setup, pick the mode that matches how you sell. For a shop, Counter / retail gives you Invoice → Payment. Only switch on features you scored for, such as batch and lot tracking or serial numbers.
- Set valuation and units. In Settings › Inventory, choose the Valuation method (weighted average or FIFO). Switch on Several units per product if you buy in boxes and sell singles.
- Add your other locations. Do this in Settings › Locations, for example your second shop.
- Bring in your products. In Inventory › Products, add products or import them. Under Stocked at, choose the locations and enter the opening stock from your fresh count. After that, stock is never typed into the product; every receipt, sale, transfer and adjustment is a movement in one log. That is the fix for the overwritten-cell problem.
- Set your opening balances. Do this in Accounting › Opening balances, so your books and stock start from the same point.
- Record your first purchase and your first sale. Then check the Restock tab in the products list, which shows what is low or out and what to reorder.
- Move stock between shops with transfer orders. A transfer is approved, picked at the source, sent and received at the destination. See locations and stock transfers.
- Connect your marketplaces. If you sell online, available stock goes out and orders come in. See connecting marketplaces.
- Invite your team. Do this in Settings › Users, giving each person only the rights they need. Cost, margin and supplier prices can be hidden with field rights.
Expert tip: Before go-live, write down your four starting numbers: weekly hours on stock records, monthly stock-outs, count variance and time to answer “what do I reorder?”. After 60 days, measure them again. That turns the switch from a feeling into a result you can show your partner, investor or bank.
Frequently asked questions
How many products is too many for an Excel inventory spreadsheet?
There is no fixed number, because movement matters more than SKU count. As a rule of thumb, above about 500 active SKUs with daily sales, keeping a sheet accurate becomes a part-time job. Use sign 1 (hours per week) as the real test.
Is Google Sheets better than Excel for inventory?
Google Sheets makes sharing easier, which helps with sign 7. It has the same core weakness, though: stock is a number anyone can overwrite, not the result of recorded movements. Moving from Excel to Sheets rarely changes your score by more than a point or two.
Can I keep using Excel alongside inventory software?
Yes, for analysis and reports you export. Do not keep stock levels in both places. Once the software is live, the spreadsheet should be read-only, or you will be reconciling two systems instead of one.
How long does it take to switch from Excel to inventory software?
For a small shop with clean data, plan for a few days of setup plus one full stock count. Messy data, many variants or several locations add time, mostly in cleaning and counting rather than in the software itself. The example above assumed 36 hours in total.
Is inventory software worth it for a very small business?
Score yourself first. If you total 0–5 and none of the override rules apply, a tidy spreadsheet is usually enough. If the cost formula shows you losing more each month than a subscription costs, software is worth it at any size.
What should I do before migrating my spreadsheet?
Give every item one unique code and merge duplicates. Standardise variant names, then count the stock at every location. Import the counted figures, not the spreadsheet’s figures, as your opening stock.
If your score came out at 6 or more, put your own numbers into the cost formula this week. If the gap looks like the example’s, the cheapest month to switch is this one. You can start a free trial of Cash Flow Inventory and set up your products, locations and opening stock before you commit.


