
Reports
Find any report by asking in plain words, compare periods, save filters, schedule e-mails, pin figures as KPIs and build monthly report packs as one PDF.
What it is
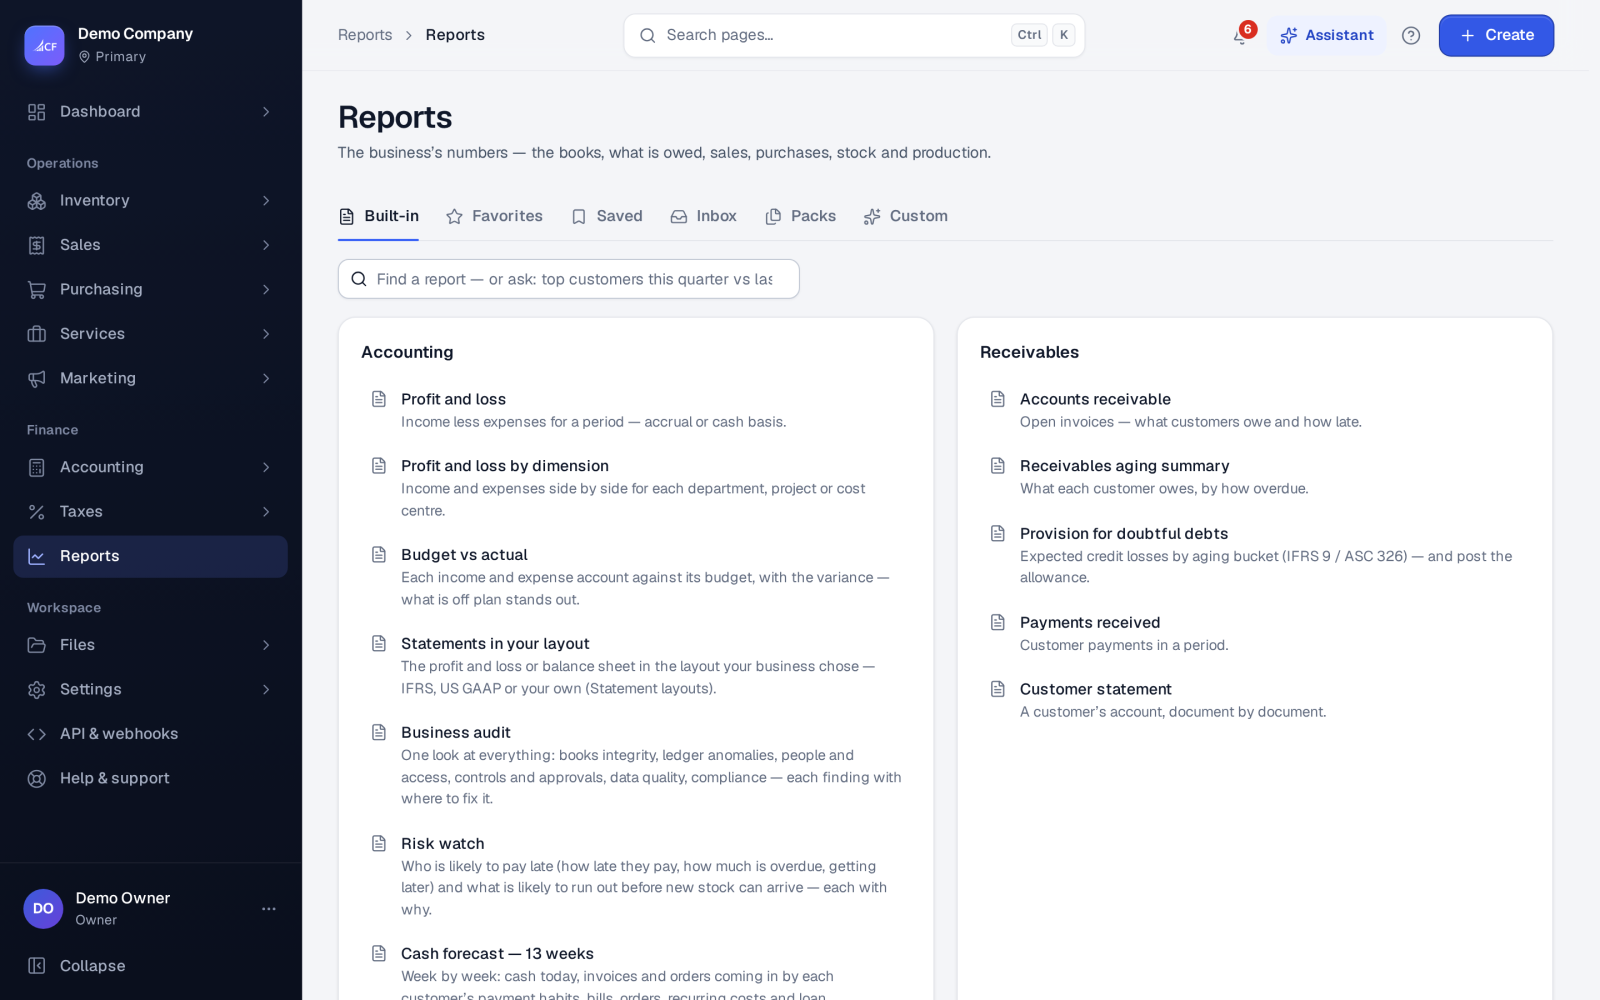
Reports is the one place for every report in the app: accounting, inventory, receivables, payables, sales, sales tax, purchases, production and services. Each report takes a period preset or your own dates, a location where it applies, and a comparison with the previous period or last year where that makes sense. Its toolbar has Print, Excel, Schedule and Pin as KPI.
Around the reports there is a small library of your own: favourite reports, saved reports with their filters, report packs, the inbox of scheduled reports and custom reports built on request.
Who it is for
- Owners who want the profit, cash and stock picture without building anything
- Accountants who send a monthly board or bank pack
- Managers who want a figure e-mailed every week, or an alert when it goes off target
- Anyone who would rather ask "top 5 customers this quarter vs last" than look for the right report
Before you start#
- Each report has its own view right. You only see, search, schedule or pin reports you may open.
- Margin and cost figures also follow field rights, so a person who may not see costs gets reports without them.
Step by step#
- Open Reports.
- Type what you want to know in the search, for example "debtors" or "sales by customer this month vs last". The best matching report opens with its filters already set.
- Choose the period, the location and Compare (previous period or last year).
- Read the report, and add a note on any line that needs explaining.
- Use Excel or Print for a file, or Schedule to have it e-mailed.
- Star it to add it to Favorite reports, or save it to keep its filters in Saved reports.
What you can do with a report#
Ask in plain words
The search turns a question into the real report with its filters set. It recognises periods (today, this or last week, month, quarter or year) and comparisons ("vs", "compared", "last year"). It is rule-based, so it gives the same answer every time and costs nothing to use.
What changed and why
For any report run with a comparison, the explanation lists the headline figures with their change, the lines that moved most in each section with their share of the change, lines that are new or gone, and any checks that failed. It is worked out by rules, the same way every time.
Notes on lines
Write a note on a report line for a period, for example "Repairs: one-off roof repair after the storm". The note appears exactly where it was written: on screen, in the print and PDF, in Excel and in scheduled e-mails. Everyone who can open the report reads it. The writer or the owner can remove it.
Schedule
Any report you may open can be e-mailed daily, weekly or monthly, at a time in your business's time zone, to up to 10 addresses. The message carries the key figures and the first rows. The whole report comes as PDF, CSV and Excel behind signed links that are valid for 14 days, plus a stop link. A relative period such as "last month" keeps each run current. A schedule runs with the rights of the person who made it, and stops by itself if that person loses access.
Pin as KPI
Pin as KPI puts a figure on the dashboard as a tile, with its period, an optional target ("bad when above / below"), the change against the previous period and a small trend line. A tile past its target turns red, shows in the bell and, if you ask, e-mails you once per breach. Tiles always run with the viewer's own rights.
Long reports
A long report, such as a year of the general ledger, can be prepared in the background. The bell tells you when it is ready, and its PDF, Excel and CSV wait in the report inbox for you alone.
Your library#
- Favorite reports: the reports you starred, one click away.
- Saved reports: reports saved with their filters. Open one to see it as it is today.
- Report packs: several reports for one period in one branded PDF, such as the monthly board or bank pack, with a cover note and your line notes. A report the person cannot open is left out and named on the cover. Packs can be scheduled like a report.
- Report inbox: every scheduled report that was sent, with its PDF and CSV, kept 14 days.
- Custom reports: reports built for your business on request, and the requests still in progress.
Report groups#
- Accounting: profit and loss (accrual or cash basis), by dimension or by period, budget vs actual, balance sheet, statements in your layout, cash forecasts, business audit and risk watch.
- Inventory: stock summary, movement, aging and reconciliation.
- Receivables and payables: aging and customer or supplier statements.
- Sales tax: tax summary and return worksheet, sales tax summary, liability and detail.
- Sales, purchases, production and services: orders, invoices, returns, work orders, promotion performance, subscription revenue and quotation pipeline.
Limits and what is not there yet#
- A report never widens what a person sees. Scheduled reports, packs and KPI tiles all run with their owner's or viewer's own rights.
- Some reports belong to a pack, for example the expiry watch for pharmacy. They open only while that pack is switched on.
- Explanations and "ask" answers are worked out by rules, not by an AI model.
Questions#
Can I send a report to my accountant every month?
Yes. Open the report, choose Schedule, pick monthly, a time and their address. Use a relative period such as "last month" so each e-mail is current.
Can I build my own report?
Use filters and save the report, or put several reports in a report pack. For something new, request a custom report from Custom reports.
Why is a figure empty for one person?
They may not have the right to see that report's costs or margins. Field rights hide those figures rather than showing them to everyone.
Can the assistant run a report?
Yes. The assistant and connected AI apps open the same reports with the person's rights, and can produce the PDF or Excel file and explain what changed.